Barbadian vs South American Indian 3 or more Vehicles in Household
COMPARE
Barbadian
South American Indian
3 or more Vehicles in Household
3 or more Vehicles in Household Comparison
Barbadians
South American Indians
12.6%
3 OR MORE VEHICLES IN HOUSEHOLD
0.0/ 100
METRIC RATING
336th/ 347
METRIC RANK
19.1%
3 OR MORE VEHICLES IN HOUSEHOLD
25.4/ 100
METRIC RATING
191st/ 347
METRIC RANK
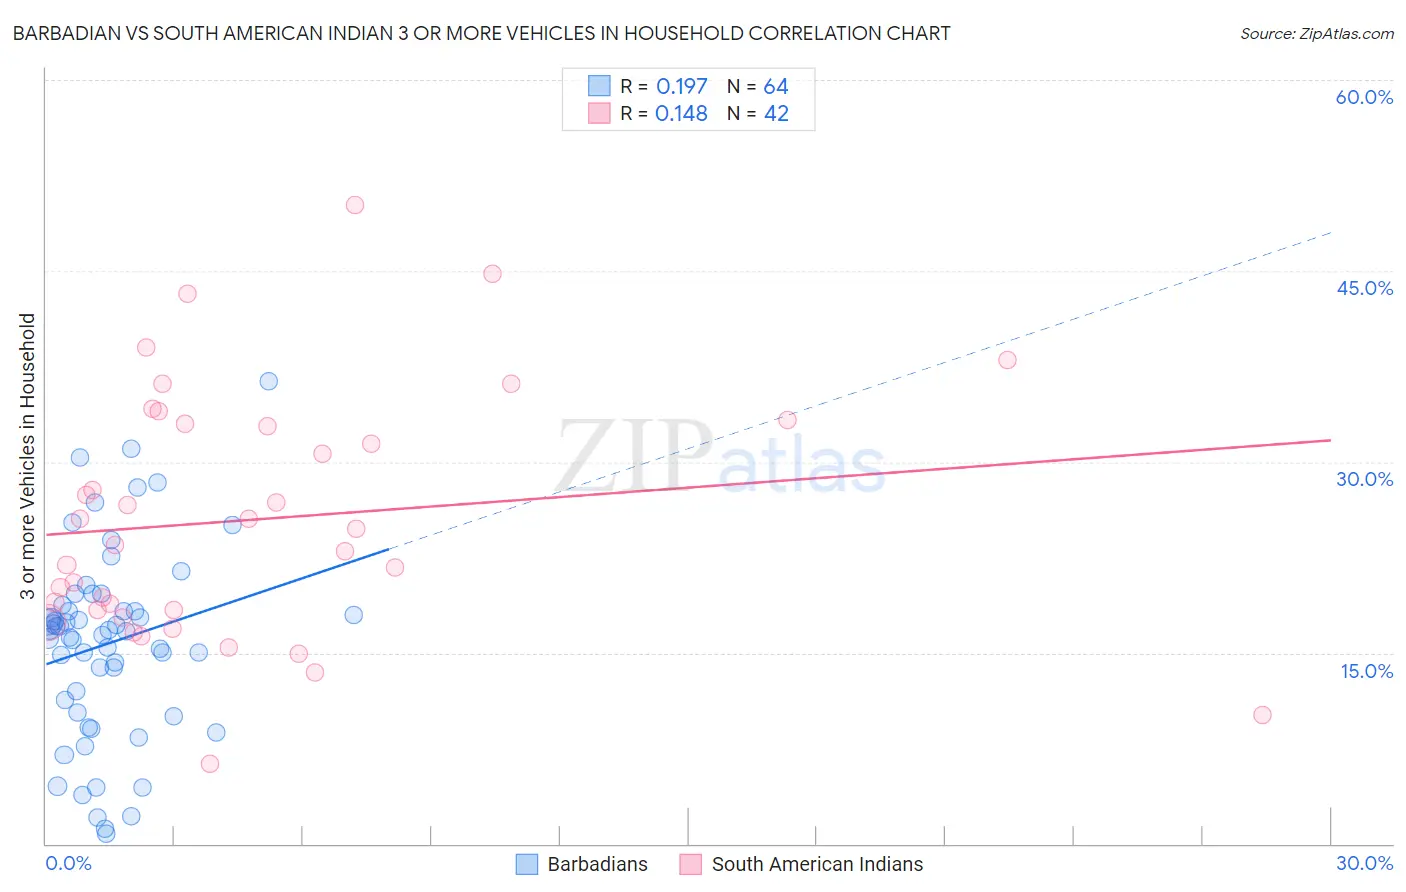
Barbadian vs South American Indian 3 or more Vehicles in Household Correlation Chart
The statistical analysis conducted on geographies consisting of 141,251,971 people shows a poor positive correlation between the proportion of Barbadians and percentage of households with 3 or more vehicles available in the United States with a correlation coefficient (R) of 0.197 and weighted average of 12.6%. Similarly, the statistical analysis conducted on geographies consisting of 164,522,375 people shows a poor positive correlation between the proportion of South American Indians and percentage of households with 3 or more vehicles available in the United States with a correlation coefficient (R) of 0.148 and weighted average of 19.1%, a difference of 51.9%.
3 or more Vehicles in Household Correlation Summary
| Measurement | Barbadian | South American Indian |
| Minimum | 0.77% | 6.3% |
| Maximum | 36.4% | 50.2% |
| Range | 35.6% | 43.9% |
| Mean | 15.8% | 25.5% |
| Median | 16.8% | 24.1% |
| Interquartile 25% (IQ1) | 10.8% | 18.3% |
| Interquartile 75% (IQ3) | 18.5% | 33.0% |
| Interquartile Range (IQR) | 7.7% | 14.7% |
| Standard Deviation (Sample) | 7.5% | 9.8% |
| Standard Deviation (Population) | 7.4% | 9.6% |
Similar Demographics by 3 or more Vehicles in Household
Demographics Similar to Barbadians by 3 or more Vehicles in Household
In terms of 3 or more vehicles in household, the demographic groups most similar to Barbadians are Immigrants from Bangladesh (12.5%, a difference of 0.44%), Vietnamese (12.5%, a difference of 0.98%), Immigrants from Uzbekistan (12.0%, a difference of 4.9%), Immigrants from Trinidad and Tobago (13.3%, a difference of 6.1%), and Immigrants from Ecuador (13.4%, a difference of 6.6%).
| Demographics | Rating | Rank | 3 or more Vehicles in Household |
| Immigrants | Senegal | 0.0 /100 | #329 | Tragic 13.8% |
| West Indians | 0.0 /100 | #330 | Tragic 13.7% |
| Immigrants | Dominica | 0.0 /100 | #331 | Tragic 13.7% |
| Trinidadians and Tobagonians | 0.0 /100 | #332 | Tragic 13.6% |
| Immigrants | Cabo Verde | 0.0 /100 | #333 | Tragic 13.6% |
| Immigrants | Ecuador | 0.0 /100 | #334 | Tragic 13.4% |
| Immigrants | Trinidad and Tobago | 0.0 /100 | #335 | Tragic 13.3% |
| Barbadians | 0.0 /100 | #336 | Tragic 12.6% |
| Immigrants | Bangladesh | 0.0 /100 | #337 | Tragic 12.5% |
| Vietnamese | 0.0 /100 | #338 | Tragic 12.5% |
| Immigrants | Uzbekistan | 0.0 /100 | #339 | Tragic 12.0% |
| Immigrants | Barbados | 0.0 /100 | #340 | Tragic 11.7% |
| Guyanese | 0.0 /100 | #341 | Tragic 11.5% |
| British West Indians | 0.0 /100 | #342 | Tragic 11.4% |
| Immigrants | Guyana | 0.0 /100 | #343 | Tragic 11.2% |
Demographics Similar to South American Indians by 3 or more Vehicles in Household
In terms of 3 or more vehicles in household, the demographic groups most similar to South American Indians are Immigrants from Zimbabwe (19.1%, a difference of 0.010%), Kenyan (19.1%, a difference of 0.060%), Immigrants from Kuwait (19.1%, a difference of 0.070%), Indian (Asian) (19.1%, a difference of 0.070%), and Tsimshian (19.1%, a difference of 0.10%).
| Demographics | Rating | Rank | 3 or more Vehicles in Household |
| Latvians | 35.7 /100 | #184 | Fair 19.3% |
| Immigrants | Sri Lanka | 30.7 /100 | #185 | Fair 19.2% |
| Immigrants | Sweden | 29.0 /100 | #186 | Fair 19.2% |
| Immigrants | Hong Kong | 28.3 /100 | #187 | Fair 19.2% |
| Immigrants | Kuwait | 26.1 /100 | #188 | Fair 19.1% |
| Indians (Asian) | 26.0 /100 | #189 | Fair 19.1% |
| Immigrants | Zimbabwe | 25.5 /100 | #190 | Fair 19.1% |
| South American Indians | 25.4 /100 | #191 | Fair 19.1% |
| Kenyans | 24.7 /100 | #192 | Fair 19.1% |
| Tsimshian | 24.4 /100 | #193 | Fair 19.1% |
| Serbians | 24.0 /100 | #194 | Fair 19.1% |
| Immigrants | Moldova | 23.6 /100 | #195 | Fair 19.1% |
| Central American Indians | 22.2 /100 | #196 | Fair 19.0% |
| Immigrants | Japan | 22.0 /100 | #197 | Fair 19.0% |
| Egyptians | 19.5 /100 | #198 | Poor 19.0% |