Marshallese vs Honduran 3 or more Vehicles in Household
COMPARE
Marshallese
Honduran
3 or more Vehicles in Household
3 or more Vehicles in Household Comparison
Marshallese
Hondurans
21.3%
3 OR MORE VEHICLES IN HOUSEHOLD
99.2/ 100
METRIC RATING
89th/ 347
METRIC RANK
18.4%
3 OR MORE VEHICLES IN HOUSEHOLD
4.6/ 100
METRIC RATING
233rd/ 347
METRIC RANK
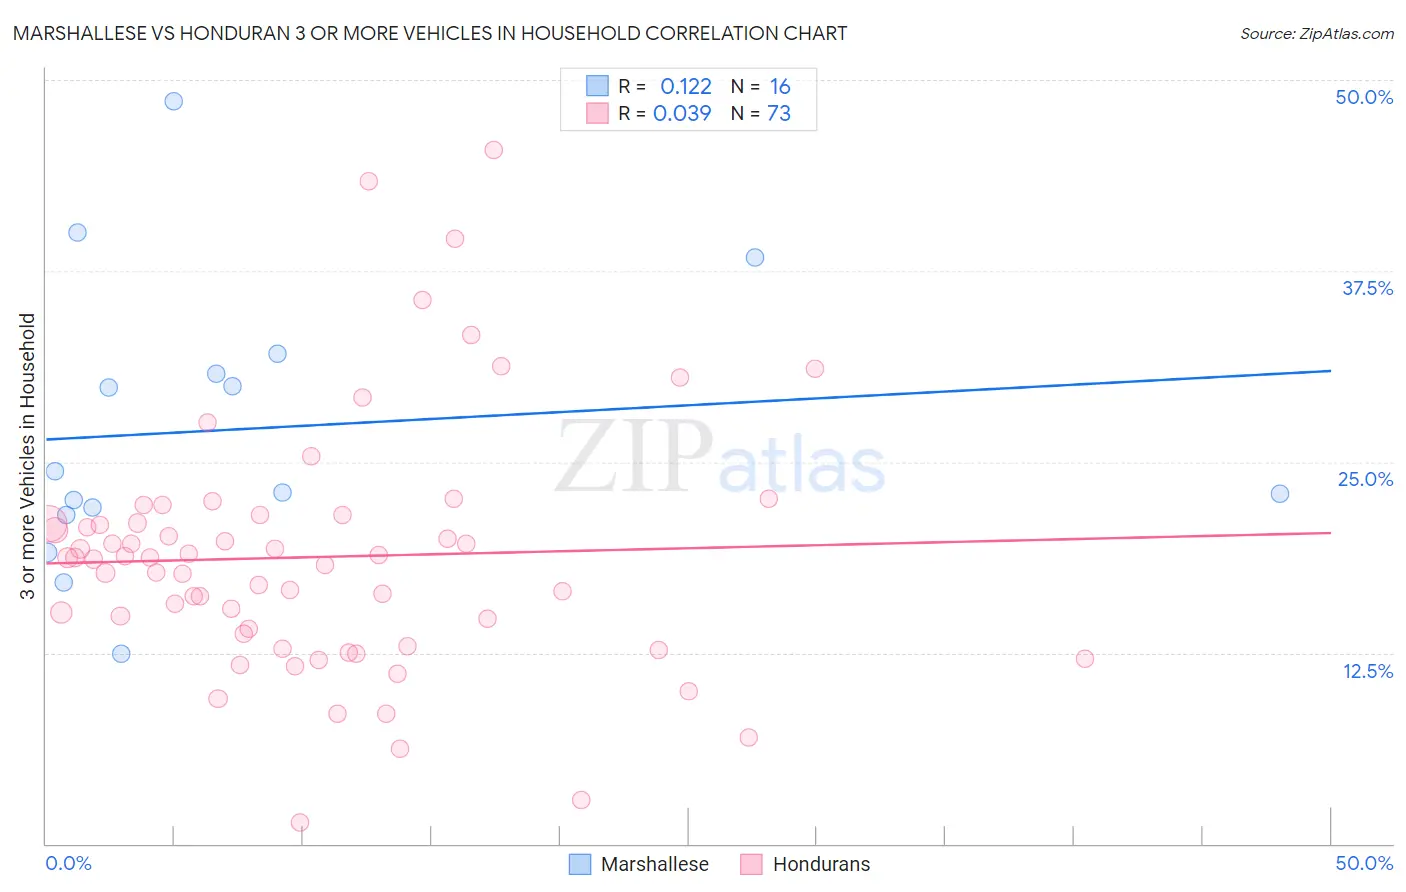
Marshallese vs Honduran 3 or more Vehicles in Household Correlation Chart
The statistical analysis conducted on geographies consisting of 14,761,315 people shows a poor positive correlation between the proportion of Marshallese and percentage of households with 3 or more vehicles available in the United States with a correlation coefficient (R) of 0.122 and weighted average of 21.3%. Similarly, the statistical analysis conducted on geographies consisting of 357,545,810 people shows no correlation between the proportion of Hondurans and percentage of households with 3 or more vehicles available in the United States with a correlation coefficient (R) of 0.039 and weighted average of 18.4%, a difference of 15.8%.
3 or more Vehicles in Household Correlation Summary
| Measurement | Marshallese | Honduran |
| Minimum | 12.4% | 1.4% |
| Maximum | 48.6% | 45.5% |
| Range | 36.2% | 44.0% |
| Mean | 27.2% | 18.8% |
| Median | 23.7% | 18.7% |
| Interquartile 25% (IQ1) | 21.8% | 13.3% |
| Interquartile 75% (IQ3) | 31.4% | 21.2% |
| Interquartile Range (IQR) | 9.6% | 7.9% |
| Standard Deviation (Sample) | 9.3% | 8.2% |
| Standard Deviation (Population) | 9.0% | 8.1% |
Similar Demographics by 3 or more Vehicles in Household
Demographics Similar to Marshallese by 3 or more Vehicles in Household
In terms of 3 or more vehicles in household, the demographic groups most similar to Marshallese are Immigrants from Afghanistan (21.2%, a difference of 0.22%), Belgian (21.2%, a difference of 0.55%), French (21.4%, a difference of 0.56%), Apache (21.2%, a difference of 0.63%), and Immigrants from the Azores (21.5%, a difference of 0.82%).
| Demographics | Rating | Rank | 3 or more Vehicles in Household |
| Immigrants | El Salvador | 99.6 /100 | #82 | Exceptional 21.5% |
| Chippewa | 99.6 /100 | #83 | Exceptional 21.5% |
| Icelanders | 99.6 /100 | #84 | Exceptional 21.5% |
| Laotians | 99.6 /100 | #85 | Exceptional 21.5% |
| Delaware | 99.6 /100 | #86 | Exceptional 21.5% |
| Immigrants | Azores | 99.5 /100 | #87 | Exceptional 21.5% |
| French | 99.4 /100 | #88 | Exceptional 21.4% |
| Marshallese | 99.2 /100 | #89 | Exceptional 21.3% |
| Immigrants | Afghanistan | 99.1 /100 | #90 | Exceptional 21.2% |
| Belgians | 98.9 /100 | #91 | Exceptional 21.2% |
| Apache | 98.9 /100 | #92 | Exceptional 21.2% |
| Immigrants | Indonesia | 98.8 /100 | #93 | Exceptional 21.1% |
| Immigrants | Cambodia | 98.6 /100 | #94 | Exceptional 21.1% |
| Pakistanis | 98.5 /100 | #95 | Exceptional 21.0% |
| Cree | 98.4 /100 | #96 | Exceptional 21.0% |
Demographics Similar to Hondurans by 3 or more Vehicles in Household
In terms of 3 or more vehicles in household, the demographic groups most similar to Hondurans are Immigrants from Uganda (18.4%, a difference of 0.020%), Immigrants from North Macedonia (18.4%, a difference of 0.070%), Immigrants from Belgium (18.4%, a difference of 0.080%), Immigrants from Western Asia (18.4%, a difference of 0.11%), and Immigrants from Switzerland (18.4%, a difference of 0.16%).
| Demographics | Rating | Rank | 3 or more Vehicles in Household |
| Immigrants | Hungary | 5.5 /100 | #226 | Tragic 18.5% |
| Immigrants | Singapore | 5.4 /100 | #227 | Tragic 18.4% |
| Turks | 5.4 /100 | #228 | Tragic 18.4% |
| Immigrants | Switzerland | 5.0 /100 | #229 | Tragic 18.4% |
| Immigrants | Western Asia | 4.8 /100 | #230 | Tragic 18.4% |
| Immigrants | Belgium | 4.8 /100 | #231 | Tragic 18.4% |
| Immigrants | Uganda | 4.6 /100 | #232 | Tragic 18.4% |
| Hondurans | 4.6 /100 | #233 | Tragic 18.4% |
| Immigrants | North Macedonia | 4.4 /100 | #234 | Tragic 18.4% |
| Sierra Leoneans | 3.9 /100 | #235 | Tragic 18.3% |
| Immigrants | Malaysia | 3.6 /100 | #236 | Tragic 18.3% |
| Indonesians | 3.5 /100 | #237 | Tragic 18.3% |
| Immigrants | Honduras | 3.1 /100 | #238 | Tragic 18.2% |
| Immigrants | Middle Africa | 3.1 /100 | #239 | Tragic 18.2% |
| Immigrants | China | 2.9 /100 | #240 | Tragic 18.2% |