Swedish vs Immigrants from Japan 3 or more Vehicles in Household
COMPARE
Swedish
Immigrants from Japan
3 or more Vehicles in Household
3 or more Vehicles in Household Comparison
Swedes
Immigrants from Japan
23.0%
3 OR MORE VEHICLES IN HOUSEHOLD
100.0/ 100
METRIC RATING
37th/ 347
METRIC RANK
19.0%
3 OR MORE VEHICLES IN HOUSEHOLD
22.0/ 100
METRIC RATING
197th/ 347
METRIC RANK
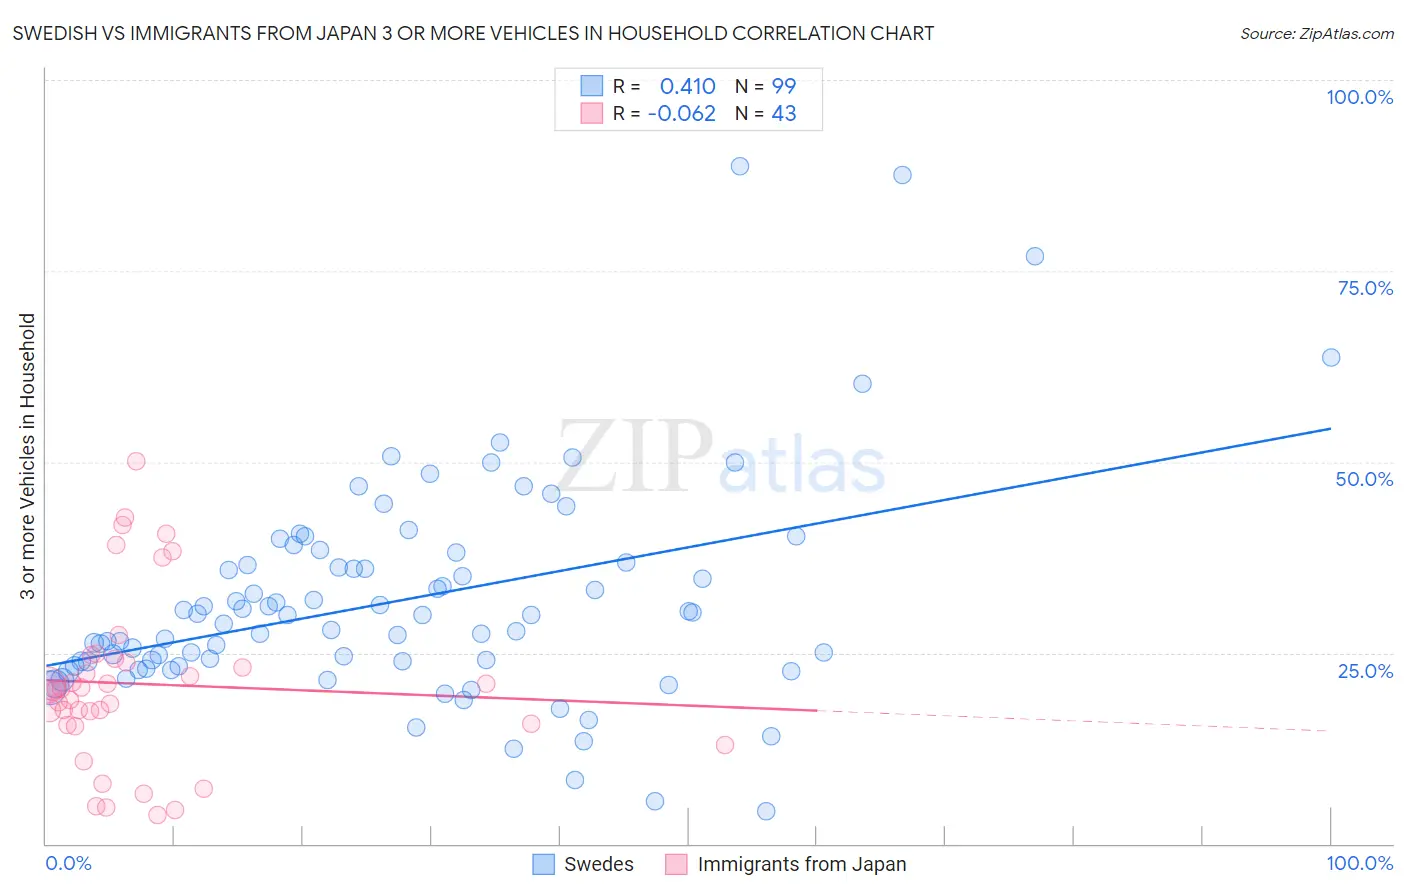
Swedish vs Immigrants from Japan 3 or more Vehicles in Household Correlation Chart
The statistical analysis conducted on geographies consisting of 538,531,467 people shows a moderate positive correlation between the proportion of Swedes and percentage of households with 3 or more vehicles available in the United States with a correlation coefficient (R) of 0.410 and weighted average of 23.0%. Similarly, the statistical analysis conducted on geographies consisting of 339,875,755 people shows a slight negative correlation between the proportion of Immigrants from Japan and percentage of households with 3 or more vehicles available in the United States with a correlation coefficient (R) of -0.062 and weighted average of 19.0%, a difference of 20.8%.
3 or more Vehicles in Household Correlation Summary
| Measurement | Swedish | Immigrants from Japan |
| Minimum | 4.2% | 3.8% |
| Maximum | 88.7% | 50.1% |
| Range | 84.5% | 46.3% |
| Mean | 31.8% | 20.9% |
| Median | 29.9% | 20.3% |
| Interquartile 25% (IQ1) | 23.3% | 15.6% |
| Interquartile 75% (IQ3) | 36.8% | 24.2% |
| Interquartile Range (IQR) | 13.5% | 8.6% |
| Standard Deviation (Sample) | 14.4% | 11.0% |
| Standard Deviation (Population) | 14.3% | 10.9% |
Similar Demographics by 3 or more Vehicles in Household
Demographics Similar to Swedes by 3 or more Vehicles in Household
In terms of 3 or more vehicles in household, the demographic groups most similar to Swedes are Cherokee (23.0%, a difference of 0.030%), Choctaw (23.0%, a difference of 0.070%), Swiss (23.0%, a difference of 0.080%), Spanish American (23.0%, a difference of 0.14%), and Pueblo (23.0%, a difference of 0.20%).
| Demographics | Rating | Rank | 3 or more Vehicles in Household |
| Immigrants | South Eastern Asia | 100.0 /100 | #30 | Exceptional 23.1% |
| English | 100.0 /100 | #31 | Exceptional 23.1% |
| Pueblo | 100.0 /100 | #32 | Exceptional 23.0% |
| Spanish Americans | 100.0 /100 | #33 | Exceptional 23.0% |
| Swiss | 100.0 /100 | #34 | Exceptional 23.0% |
| Choctaw | 100.0 /100 | #35 | Exceptional 23.0% |
| Cherokee | 100.0 /100 | #36 | Exceptional 23.0% |
| Swedes | 100.0 /100 | #37 | Exceptional 23.0% |
| Dutch | 100.0 /100 | #38 | Exceptional 22.9% |
| Yaqui | 100.0 /100 | #39 | Exceptional 22.9% |
| Europeans | 100.0 /100 | #40 | Exceptional 22.9% |
| Germans | 100.0 /100 | #41 | Exceptional 22.7% |
| Natives/Alaskans | 100.0 /100 | #42 | Exceptional 22.7% |
| Osage | 100.0 /100 | #43 | Exceptional 22.7% |
| Cheyenne | 100.0 /100 | #44 | Exceptional 22.7% |
Demographics Similar to Immigrants from Japan by 3 or more Vehicles in Household
In terms of 3 or more vehicles in household, the demographic groups most similar to Immigrants from Japan are Central American Indian (19.0%, a difference of 0.030%), Immigrants from Moldova (19.1%, a difference of 0.18%), Serbian (19.1%, a difference of 0.22%), Tsimshian (19.1%, a difference of 0.26%), and Kenyan (19.1%, a difference of 0.30%).
| Demographics | Rating | Rank | 3 or more Vehicles in Household |
| Immigrants | Zimbabwe | 25.5 /100 | #190 | Fair 19.1% |
| South American Indians | 25.4 /100 | #191 | Fair 19.1% |
| Kenyans | 24.7 /100 | #192 | Fair 19.1% |
| Tsimshian | 24.4 /100 | #193 | Fair 19.1% |
| Serbians | 24.0 /100 | #194 | Fair 19.1% |
| Immigrants | Moldova | 23.6 /100 | #195 | Fair 19.1% |
| Central American Indians | 22.2 /100 | #196 | Fair 19.0% |
| Immigrants | Japan | 22.0 /100 | #197 | Fair 19.0% |
| Egyptians | 19.5 /100 | #198 | Poor 19.0% |
| Immigrants | Norway | 19.0 /100 | #199 | Poor 19.0% |
| Argentineans | 18.2 /100 | #200 | Poor 18.9% |
| Arabs | 17.7 /100 | #201 | Poor 18.9% |
| Immigrants | Austria | 15.4 /100 | #202 | Poor 18.9% |
| Tohono O'odham | 14.8 /100 | #203 | Poor 18.9% |
| Immigrants | Romania | 14.6 /100 | #204 | Poor 18.9% |