Subsaharan African vs Swiss 3 or more Vehicles in Household
COMPARE
Subsaharan African
Swiss
3 or more Vehicles in Household
3 or more Vehicles in Household Comparison
Sub-Saharan Africans
Swiss
17.9%
3 OR MORE VEHICLES IN HOUSEHOLD
1.1/ 100
METRIC RATING
256th/ 347
METRIC RANK
23.0%
3 OR MORE VEHICLES IN HOUSEHOLD
100.0/ 100
METRIC RATING
34th/ 347
METRIC RANK
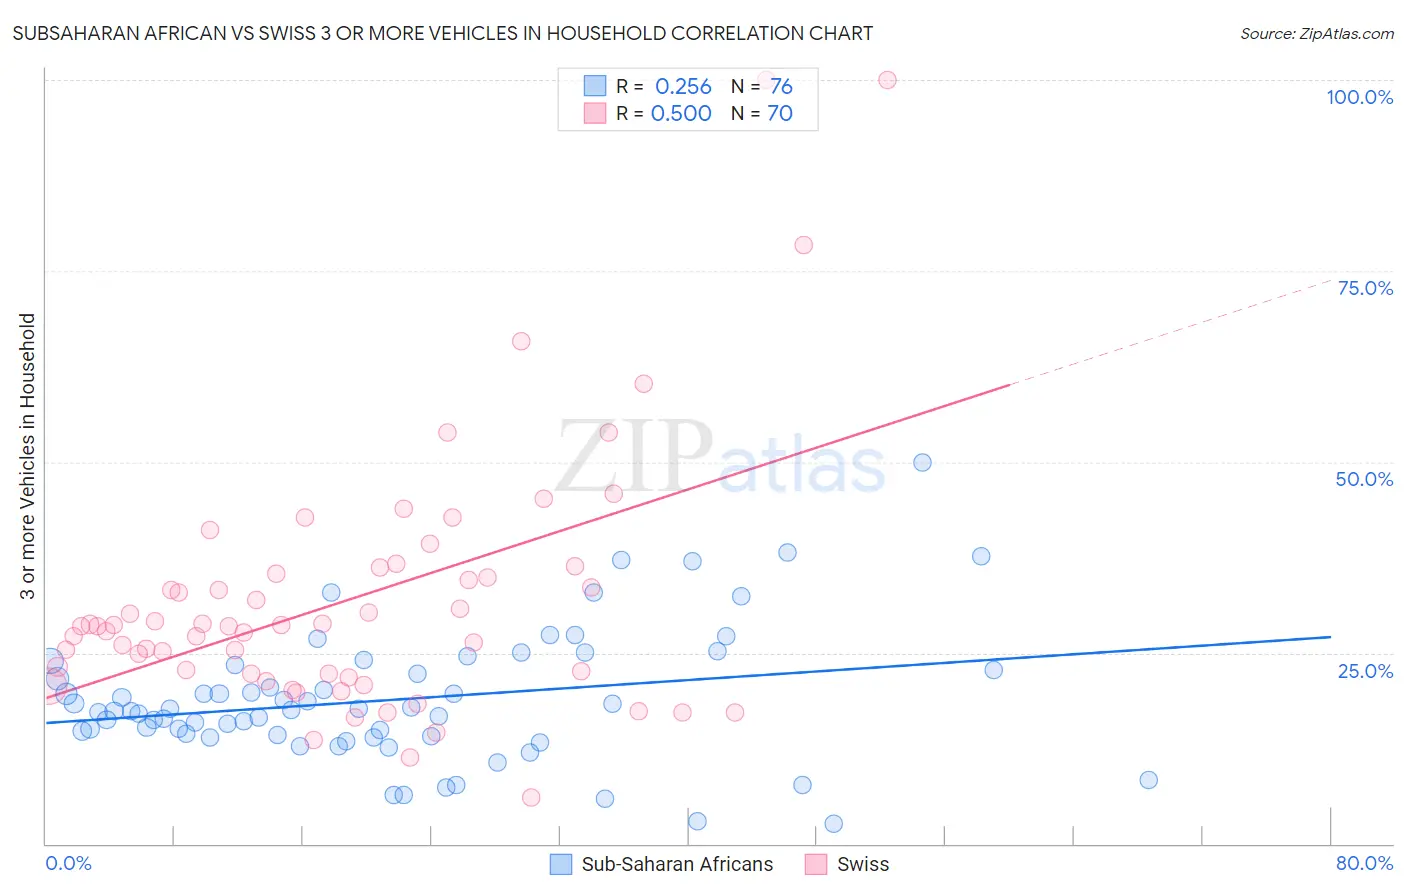
Subsaharan African vs Swiss 3 or more Vehicles in Household Correlation Chart
The statistical analysis conducted on geographies consisting of 507,393,924 people shows a weak positive correlation between the proportion of Sub-Saharan Africans and percentage of households with 3 or more vehicles available in the United States with a correlation coefficient (R) of 0.256 and weighted average of 17.9%. Similarly, the statistical analysis conducted on geographies consisting of 464,647,007 people shows a moderate positive correlation between the proportion of Swiss and percentage of households with 3 or more vehicles available in the United States with a correlation coefficient (R) of 0.500 and weighted average of 23.0%, a difference of 28.8%.
3 or more Vehicles in Household Correlation Summary
| Measurement | Subsaharan African | Swiss |
| Minimum | 2.7% | 6.1% |
| Maximum | 50.0% | 100.0% |
| Range | 47.3% | 93.9% |
| Mean | 18.9% | 31.9% |
| Median | 17.4% | 28.5% |
| Interquartile 25% (IQ1) | 14.2% | 22.3% |
| Interquartile 75% (IQ3) | 23.0% | 35.4% |
| Interquartile Range (IQR) | 8.9% | 13.1% |
| Standard Deviation (Sample) | 8.6% | 17.1% |
| Standard Deviation (Population) | 8.5% | 17.0% |
Similar Demographics by 3 or more Vehicles in Household
Demographics Similar to Sub-Saharan Africans by 3 or more Vehicles in Household
In terms of 3 or more vehicles in household, the demographic groups most similar to Sub-Saharan Africans are Immigrants from Eritrea (17.8%, a difference of 0.050%), Sudanese (17.8%, a difference of 0.050%), Immigrants from Turkey (17.9%, a difference of 0.15%), Ethiopian (17.9%, a difference of 0.18%), and Immigrants from Ethiopia (17.9%, a difference of 0.19%).
| Demographics | Rating | Rank | 3 or more Vehicles in Household |
| Immigrants | Saudi Arabia | 1.7 /100 | #249 | Tragic 18.0% |
| Venezuelans | 1.7 /100 | #250 | Tragic 18.0% |
| Alsatians | 1.5 /100 | #251 | Tragic 18.0% |
| Immigrants | Southern Europe | 1.4 /100 | #252 | Tragic 17.9% |
| Immigrants | Ethiopia | 1.3 /100 | #253 | Tragic 17.9% |
| Ethiopians | 1.2 /100 | #254 | Tragic 17.9% |
| Immigrants | Turkey | 1.2 /100 | #255 | Tragic 17.9% |
| Sub-Saharan Africans | 1.1 /100 | #256 | Tragic 17.9% |
| Immigrants | Eritrea | 1.1 /100 | #257 | Tragic 17.8% |
| Sudanese | 1.1 /100 | #258 | Tragic 17.8% |
| Uruguayans | 1.0 /100 | #259 | Tragic 17.8% |
| Ugandans | 0.9 /100 | #260 | Tragic 17.8% |
| Immigrants | Northern Africa | 0.9 /100 | #261 | Tragic 17.8% |
| Colombians | 0.9 /100 | #262 | Tragic 17.8% |
| Bermudans | 0.9 /100 | #263 | Tragic 17.8% |
Demographics Similar to Swiss by 3 or more Vehicles in Household
In terms of 3 or more vehicles in household, the demographic groups most similar to Swiss are Choctaw (23.0%, a difference of 0.020%), Spanish American (23.0%, a difference of 0.050%), Cherokee (23.0%, a difference of 0.060%), Swedish (23.0%, a difference of 0.080%), and Pueblo (23.0%, a difference of 0.11%).
| Demographics | Rating | Rank | 3 or more Vehicles in Household |
| Guamanians/Chamorros | 100.0 /100 | #27 | Exceptional 23.2% |
| Lumbee | 100.0 /100 | #28 | Exceptional 23.1% |
| Spanish | 100.0 /100 | #29 | Exceptional 23.1% |
| Immigrants | South Eastern Asia | 100.0 /100 | #30 | Exceptional 23.1% |
| English | 100.0 /100 | #31 | Exceptional 23.1% |
| Pueblo | 100.0 /100 | #32 | Exceptional 23.0% |
| Spanish Americans | 100.0 /100 | #33 | Exceptional 23.0% |
| Swiss | 100.0 /100 | #34 | Exceptional 23.0% |
| Choctaw | 100.0 /100 | #35 | Exceptional 23.0% |
| Cherokee | 100.0 /100 | #36 | Exceptional 23.0% |
| Swedes | 100.0 /100 | #37 | Exceptional 23.0% |
| Dutch | 100.0 /100 | #38 | Exceptional 22.9% |
| Yaqui | 100.0 /100 | #39 | Exceptional 22.9% |
| Europeans | 100.0 /100 | #40 | Exceptional 22.9% |
| Germans | 100.0 /100 | #41 | Exceptional 22.7% |