Immigrants from Eritrea vs Romanian 2 or more Vehicles in Household
COMPARE
Immigrants from Eritrea
Romanian
2 or more Vehicles in Household
2 or more Vehicles in Household Comparison
Immigrants from Eritrea
Romanians
52.6%
2 OR MORE VEHICLES IN HOUSEHOLD
0.7/ 100
METRIC RATING
256th/ 347
METRIC RANK
55.5%
2 OR MORE VEHICLES IN HOUSEHOLD
55.8/ 100
METRIC RATING
170th/ 347
METRIC RANK
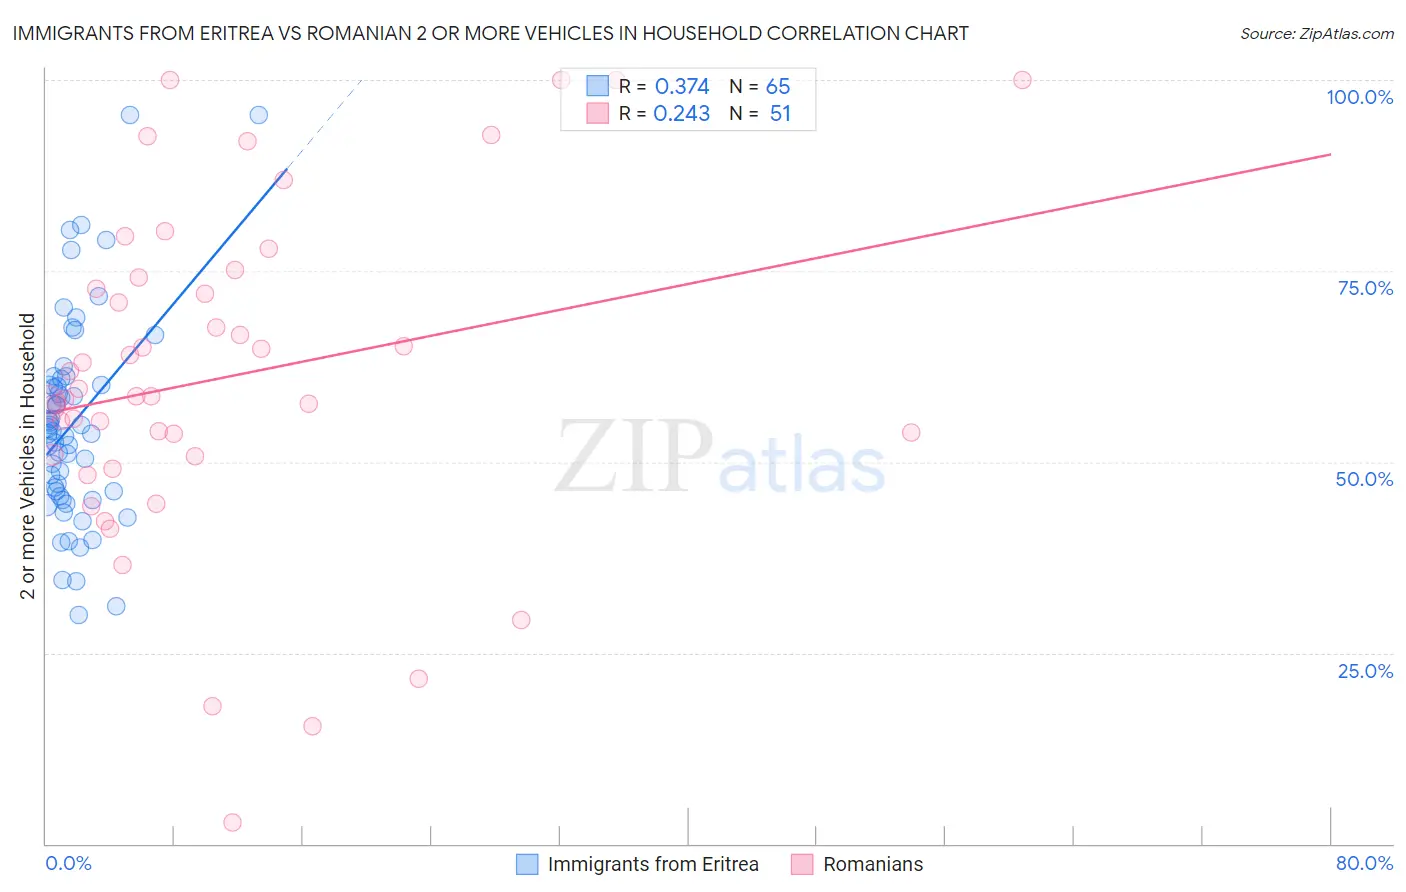
Immigrants from Eritrea vs Romanian 2 or more Vehicles in Household Correlation Chart
The statistical analysis conducted on geographies consisting of 104,847,164 people shows a mild positive correlation between the proportion of Immigrants from Eritrea and percentage of households with 2 or more vehicles available in the United States with a correlation coefficient (R) of 0.374 and weighted average of 52.6%. Similarly, the statistical analysis conducted on geographies consisting of 377,750,071 people shows a weak positive correlation between the proportion of Romanians and percentage of households with 2 or more vehicles available in the United States with a correlation coefficient (R) of 0.243 and weighted average of 55.5%, a difference of 5.4%.
2 or more Vehicles in Household Correlation Summary
| Measurement | Immigrants from Eritrea | Romanian |
| Minimum | 30.0% | 2.7% |
| Maximum | 95.5% | 100.0% |
| Range | 65.4% | 97.3% |
| Mean | 55.1% | 61.1% |
| Median | 54.0% | 58.6% |
| Interquartile 25% (IQ1) | 45.8% | 50.7% |
| Interquartile 75% (IQ3) | 60.5% | 74.2% |
| Interquartile Range (IQR) | 14.7% | 23.5% |
| Standard Deviation (Sample) | 13.5% | 22.0% |
| Standard Deviation (Population) | 13.4% | 21.8% |
Similar Demographics by 2 or more Vehicles in Household
Demographics Similar to Immigrants from Eritrea by 2 or more Vehicles in Household
In terms of 2 or more vehicles in household, the demographic groups most similar to Immigrants from Eritrea are Uruguayan (52.7%, a difference of 0.040%), Immigrants from Malaysia (52.7%, a difference of 0.070%), Immigrants from Hong Kong (52.6%, a difference of 0.14%), Central American Indian (52.5%, a difference of 0.24%), and Nigerian (52.8%, a difference of 0.26%).
| Demographics | Rating | Rank | 2 or more Vehicles in Household |
| Immigrants | Brazil | 1.0 /100 | #249 | Tragic 52.8% |
| Mongolians | 1.0 /100 | #250 | Tragic 52.8% |
| Immigrants | Sudan | 1.0 /100 | #251 | Tragic 52.8% |
| Immigrants | Portugal | 1.0 /100 | #252 | Tragic 52.8% |
| Nigerians | 0.9 /100 | #253 | Tragic 52.8% |
| Immigrants | Malaysia | 0.8 /100 | #254 | Tragic 52.7% |
| Uruguayans | 0.7 /100 | #255 | Tragic 52.7% |
| Immigrants | Eritrea | 0.7 /100 | #256 | Tragic 52.6% |
| Immigrants | Hong Kong | 0.6 /100 | #257 | Tragic 52.6% |
| Central American Indians | 0.6 /100 | #258 | Tragic 52.5% |
| Alsatians | 0.6 /100 | #259 | Tragic 52.5% |
| Immigrants | Bahamas | 0.5 /100 | #260 | Tragic 52.5% |
| Immigrants | Australia | 0.5 /100 | #261 | Tragic 52.4% |
| Immigrants | Northern Africa | 0.4 /100 | #262 | Tragic 52.3% |
| Immigrants | Southern Europe | 0.4 /100 | #263 | Tragic 52.3% |
Demographics Similar to Romanians by 2 or more Vehicles in Household
In terms of 2 or more vehicles in household, the demographic groups most similar to Romanians are Immigrants from Austria (55.5%, a difference of 0.020%), French American Indian (55.5%, a difference of 0.030%), Immigrants from Costa Rica (55.4%, a difference of 0.060%), Kenyan (55.5%, a difference of 0.090%), and Immigrants from Sri Lanka (55.5%, a difference of 0.10%).
| Demographics | Rating | Rank | 2 or more Vehicles in Household |
| Immigrants | Zimbabwe | 60.2 /100 | #163 | Good 55.6% |
| Dutch West Indians | 59.8 /100 | #164 | Average 55.6% |
| Immigrants | El Salvador | 59.4 /100 | #165 | Average 55.6% |
| Immigrants | Sri Lanka | 58.3 /100 | #166 | Average 55.5% |
| Kenyans | 58.1 /100 | #167 | Average 55.5% |
| French American Indians | 56.7 /100 | #168 | Average 55.5% |
| Immigrants | Austria | 56.3 /100 | #169 | Average 55.5% |
| Romanians | 55.8 /100 | #170 | Average 55.5% |
| Immigrants | Costa Rica | 54.4 /100 | #171 | Average 55.4% |
| Immigrants | Nicaragua | 51.6 /100 | #172 | Average 55.4% |
| Immigrants | Western Europe | 51.4 /100 | #173 | Average 55.4% |
| Navajo | 50.0 /100 | #174 | Average 55.3% |
| Immigrants | Denmark | 49.4 /100 | #175 | Average 55.3% |
| Immigrants | Cuba | 47.0 /100 | #176 | Average 55.3% |
| Menominee | 46.2 /100 | #177 | Average 55.3% |