South American vs Romanian Bachelor's Degree
COMPARE
South American
Romanian
Bachelor's Degree
Bachelor's Degree Comparison
South Americans
Romanians
38.9%
BACHELOR'S DEGREE
77.3/ 100
METRIC RATING
150th/ 347
METRIC RANK
41.6%
BACHELOR'S DEGREE
98.4/ 100
METRIC RATING
97th/ 347
METRIC RANK
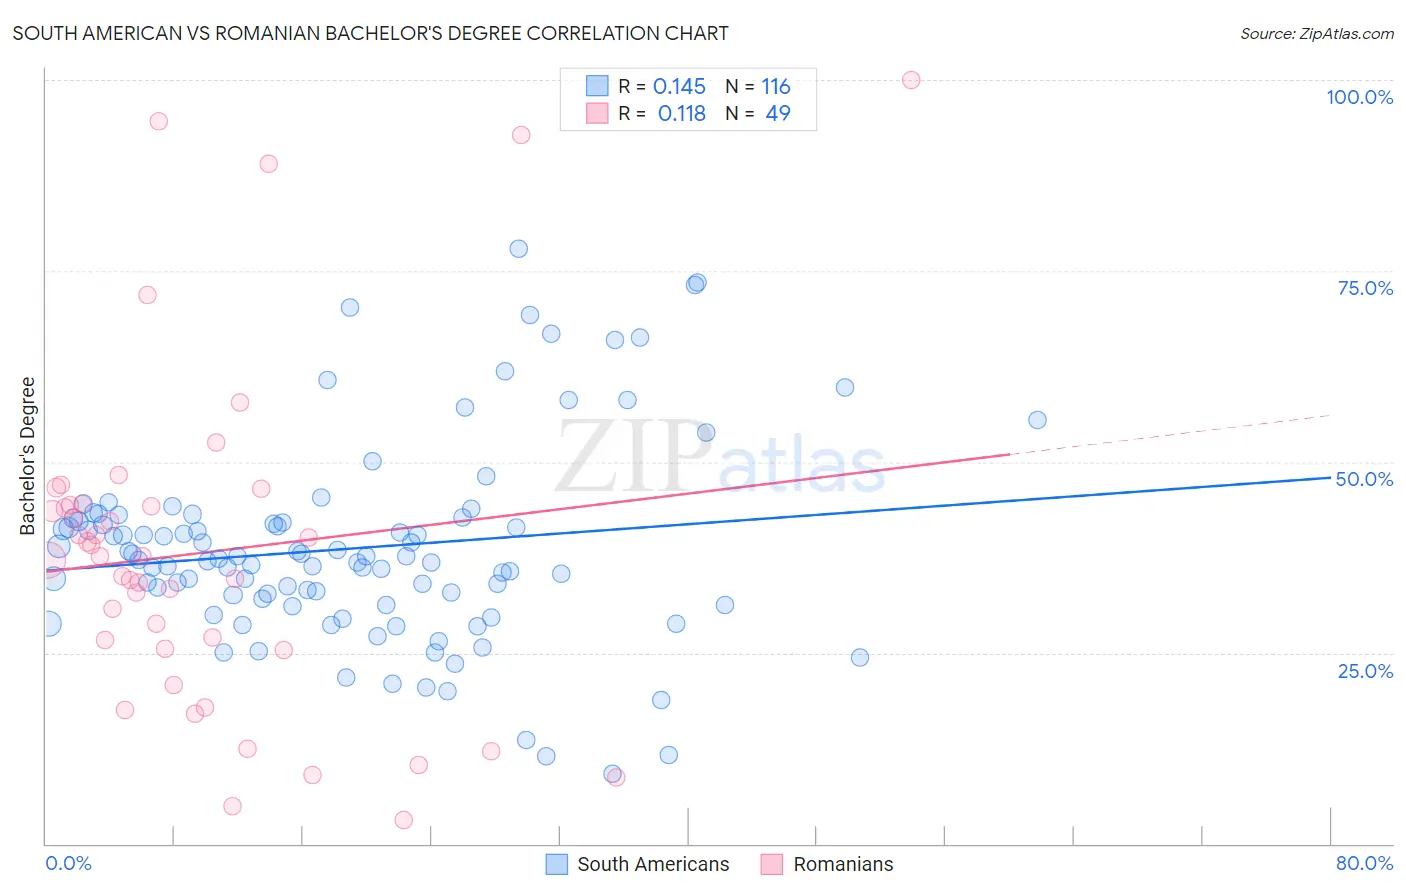
South American vs Romanian Bachelor's Degree Correlation Chart
The statistical analysis conducted on geographies consisting of 494,094,255 people shows a poor positive correlation between the proportion of South Americans and percentage of population with at least bachelor's degree education in the United States with a correlation coefficient (R) of 0.145 and weighted average of 38.9%. Similarly, the statistical analysis conducted on geographies consisting of 377,865,873 people shows a poor positive correlation between the proportion of Romanians and percentage of population with at least bachelor's degree education in the United States with a correlation coefficient (R) of 0.118 and weighted average of 41.6%, a difference of 6.8%.
Bachelor's Degree Correlation Summary
| Measurement | South American | Romanian |
| Minimum | 9.1% | 3.1% |
| Maximum | 77.9% | 100.0% |
| Range | 68.8% | 96.9% |
| Mean | 38.6% | 38.1% |
| Median | 37.2% | 37.6% |
| Interquartile 25% (IQ1) | 31.7% | 25.5% |
| Interquartile 75% (IQ3) | 42.4% | 44.4% |
| Interquartile Range (IQR) | 10.7% | 18.9% |
| Standard Deviation (Sample) | 13.0% | 22.1% |
| Standard Deviation (Population) | 12.9% | 21.9% |
Similar Demographics by Bachelor's Degree
Demographics Similar to South Americans by Bachelor's Degree
In terms of bachelor's degree, the demographic groups most similar to South Americans are Immigrants from Poland (39.0%, a difference of 0.030%), Immigrants from Africa (38.9%, a difference of 0.10%), Iraqi (39.0%, a difference of 0.11%), Sudanese (38.9%, a difference of 0.12%), and Slavic (38.9%, a difference of 0.18%).
| Demographics | Rating | Rank | Bachelor's Degree |
| Poles | 79.8 /100 | #143 | Good 39.1% |
| Immigrants | Afghanistan | 79.7 /100 | #144 | Good 39.1% |
| Slovenes | 79.5 /100 | #145 | Good 39.1% |
| Swedes | 79.2 /100 | #146 | Good 39.1% |
| Immigrants | Sierra Leone | 79.0 /100 | #147 | Good 39.0% |
| Iraqis | 78.1 /100 | #148 | Good 39.0% |
| Immigrants | Poland | 77.5 /100 | #149 | Good 39.0% |
| South Americans | 77.3 /100 | #150 | Good 38.9% |
| Immigrants | Africa | 76.5 /100 | #151 | Good 38.9% |
| Sudanese | 76.4 /100 | #152 | Good 38.9% |
| Slavs | 75.9 /100 | #153 | Good 38.9% |
| Canadians | 75.0 /100 | #154 | Good 38.8% |
| Immigrants | Kenya | 73.8 /100 | #155 | Good 38.8% |
| Kenyans | 72.5 /100 | #156 | Good 38.7% |
| Immigrants | South America | 70.1 /100 | #157 | Good 38.6% |
Demographics Similar to Romanians by Bachelor's Degree
In terms of bachelor's degree, the demographic groups most similar to Romanians are Immigrants from Moldova (41.6%, a difference of 0.050%), Immigrants from Ukraine (41.5%, a difference of 0.11%), Immigrants from North America (41.7%, a difference of 0.16%), Immigrants from Nepal (41.7%, a difference of 0.29%), and Immigrants from Canada (41.7%, a difference of 0.31%).
| Demographics | Rating | Rank | Bachelor's Degree |
| Laotians | 98.9 /100 | #90 | Exceptional 42.0% |
| Immigrants | Northern Africa | 98.9 /100 | #91 | Exceptional 41.9% |
| Maltese | 98.8 /100 | #92 | Exceptional 41.9% |
| Immigrants | Canada | 98.6 /100 | #93 | Exceptional 41.7% |
| Immigrants | Nepal | 98.6 /100 | #94 | Exceptional 41.7% |
| Immigrants | North America | 98.5 /100 | #95 | Exceptional 41.7% |
| Immigrants | Moldova | 98.4 /100 | #96 | Exceptional 41.6% |
| Romanians | 98.4 /100 | #97 | Exceptional 41.6% |
| Immigrants | Ukraine | 98.3 /100 | #98 | Exceptional 41.5% |
| Immigrants | England | 98.1 /100 | #99 | Exceptional 41.4% |
| Macedonians | 98.1 /100 | #100 | Exceptional 41.4% |
| Immigrants | Morocco | 98.0 /100 | #101 | Exceptional 41.4% |
| Immigrants | Italy | 97.8 /100 | #102 | Exceptional 41.3% |
| Chileans | 97.5 /100 | #103 | Exceptional 41.2% |
| Jordanians | 97.4 /100 | #104 | Exceptional 41.2% |