Samoan vs Romanian 2 or more Vehicles in Household
COMPARE
Samoan
Romanian
2 or more Vehicles in Household
2 or more Vehicles in Household Comparison
Samoans
Romanians
61.5%
2 OR MORE VEHICLES IN HOUSEHOLD
100.0/ 100
METRIC RATING
13th/ 347
METRIC RANK
55.5%
2 OR MORE VEHICLES IN HOUSEHOLD
55.8/ 100
METRIC RATING
170th/ 347
METRIC RANK
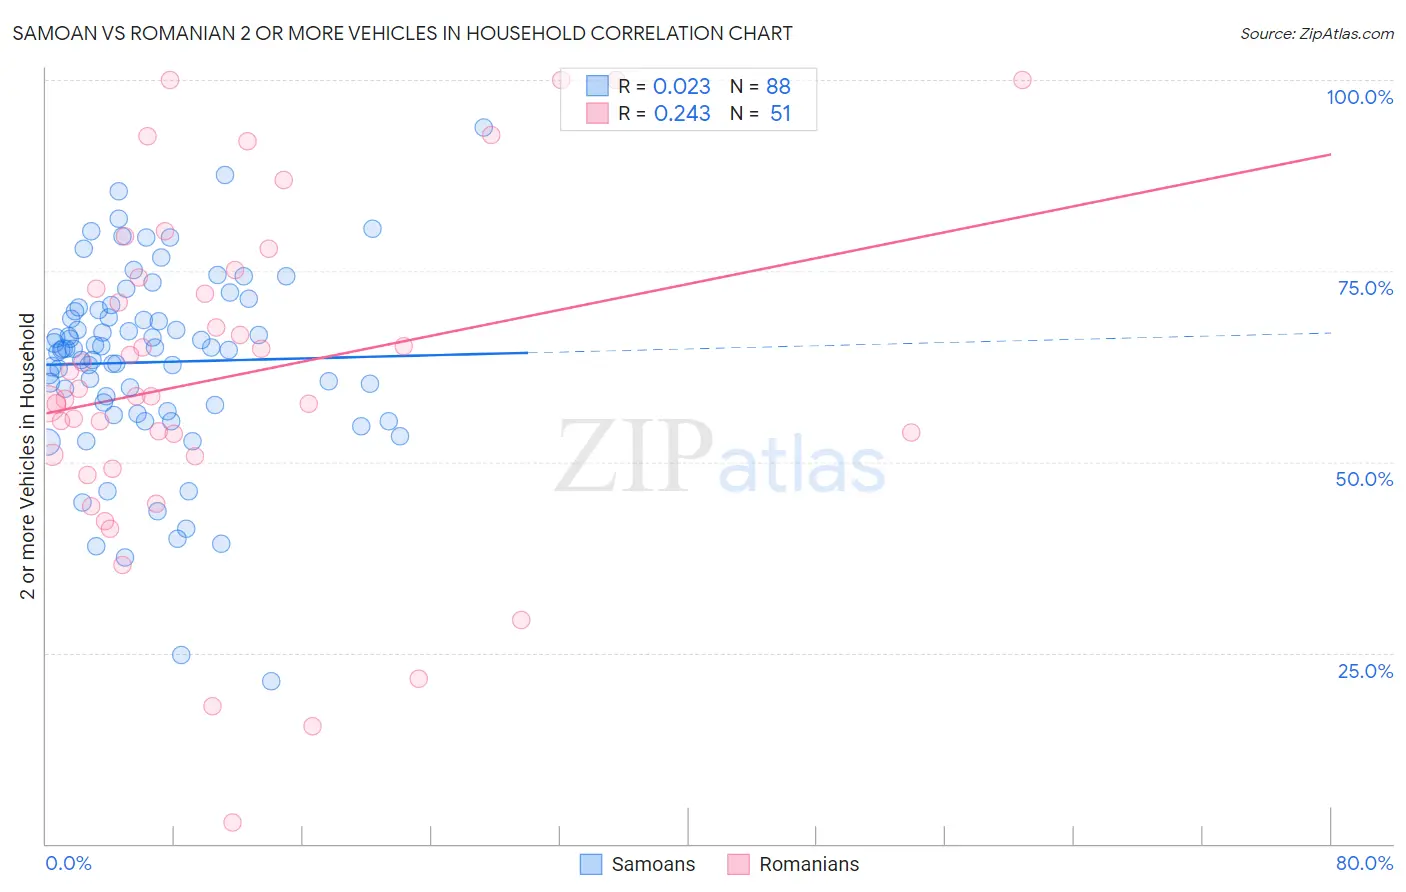
Samoan vs Romanian 2 or more Vehicles in Household Correlation Chart
The statistical analysis conducted on geographies consisting of 225,081,669 people shows no correlation between the proportion of Samoans and percentage of households with 2 or more vehicles available in the United States with a correlation coefficient (R) of 0.023 and weighted average of 61.5%. Similarly, the statistical analysis conducted on geographies consisting of 377,750,071 people shows a weak positive correlation between the proportion of Romanians and percentage of households with 2 or more vehicles available in the United States with a correlation coefficient (R) of 0.243 and weighted average of 55.5%, a difference of 10.9%.
2 or more Vehicles in Household Correlation Summary
| Measurement | Samoan | Romanian |
| Minimum | 21.3% | 2.7% |
| Maximum | 93.8% | 100.0% |
| Range | 72.4% | 97.3% |
| Mean | 63.1% | 61.1% |
| Median | 64.8% | 58.6% |
| Interquartile 25% (IQ1) | 57.1% | 50.7% |
| Interquartile 75% (IQ3) | 69.8% | 74.2% |
| Interquartile Range (IQR) | 12.7% | 23.5% |
| Standard Deviation (Sample) | 12.6% | 22.0% |
| Standard Deviation (Population) | 12.5% | 21.8% |
Similar Demographics by 2 or more Vehicles in Household
Demographics Similar to Samoans by 2 or more Vehicles in Household
In terms of 2 or more vehicles in household, the demographic groups most similar to Samoans are Czech (61.5%, a difference of 0.050%), German (61.6%, a difference of 0.12%), Nepalese (61.4%, a difference of 0.14%), Native Hawaiian (61.4%, a difference of 0.16%), and Basque (61.4%, a difference of 0.22%).
| Demographics | Rating | Rank | 2 or more Vehicles in Household |
| Scandinavians | 100.0 /100 | #6 | Exceptional 62.1% |
| Puget Sound Salish | 100.0 /100 | #7 | Exceptional 62.1% |
| English | 100.0 /100 | #8 | Exceptional 61.9% |
| Swedes | 100.0 /100 | #9 | Exceptional 61.8% |
| Mexicans | 100.0 /100 | #10 | Exceptional 61.7% |
| Dutch | 100.0 /100 | #11 | Exceptional 61.6% |
| Germans | 100.0 /100 | #12 | Exceptional 61.6% |
| Samoans | 100.0 /100 | #13 | Exceptional 61.5% |
| Czechs | 100.0 /100 | #14 | Exceptional 61.5% |
| Nepalese | 100.0 /100 | #15 | Exceptional 61.4% |
| Native Hawaiians | 100.0 /100 | #16 | Exceptional 61.4% |
| Basques | 100.0 /100 | #17 | Exceptional 61.4% |
| Europeans | 100.0 /100 | #18 | Exceptional 61.4% |
| Scottish | 100.0 /100 | #19 | Exceptional 61.2% |
| Sri Lankans | 100.0 /100 | #20 | Exceptional 61.0% |
Demographics Similar to Romanians by 2 or more Vehicles in Household
In terms of 2 or more vehicles in household, the demographic groups most similar to Romanians are Immigrants from Austria (55.5%, a difference of 0.020%), French American Indian (55.5%, a difference of 0.030%), Immigrants from Costa Rica (55.4%, a difference of 0.060%), Kenyan (55.5%, a difference of 0.090%), and Immigrants from Sri Lanka (55.5%, a difference of 0.10%).
| Demographics | Rating | Rank | 2 or more Vehicles in Household |
| Immigrants | Zimbabwe | 60.2 /100 | #163 | Good 55.6% |
| Dutch West Indians | 59.8 /100 | #164 | Average 55.6% |
| Immigrants | El Salvador | 59.4 /100 | #165 | Average 55.6% |
| Immigrants | Sri Lanka | 58.3 /100 | #166 | Average 55.5% |
| Kenyans | 58.1 /100 | #167 | Average 55.5% |
| French American Indians | 56.7 /100 | #168 | Average 55.5% |
| Immigrants | Austria | 56.3 /100 | #169 | Average 55.5% |
| Romanians | 55.8 /100 | #170 | Average 55.5% |
| Immigrants | Costa Rica | 54.4 /100 | #171 | Average 55.4% |
| Immigrants | Nicaragua | 51.6 /100 | #172 | Average 55.4% |
| Immigrants | Western Europe | 51.4 /100 | #173 | Average 55.4% |
| Navajo | 50.0 /100 | #174 | Average 55.3% |
| Immigrants | Denmark | 49.4 /100 | #175 | Average 55.3% |
| Immigrants | Cuba | 47.0 /100 | #176 | Average 55.3% |
| Menominee | 46.2 /100 | #177 | Average 55.3% |