South American Indian vs Immigrants from Ukraine 2 or more Vehicles in Household
COMPARE
South American Indian
Immigrants from Ukraine
2 or more Vehicles in Household
2 or more Vehicles in Household Comparison
South American Indians
Immigrants from Ukraine
53.9%
2 OR MORE VEHICLES IN HOUSEHOLD
6.5/ 100
METRIC RATING
219th/ 347
METRIC RANK
50.9%
2 OR MORE VEHICLES IN HOUSEHOLD
0.0/ 100
METRIC RATING
292nd/ 347
METRIC RANK
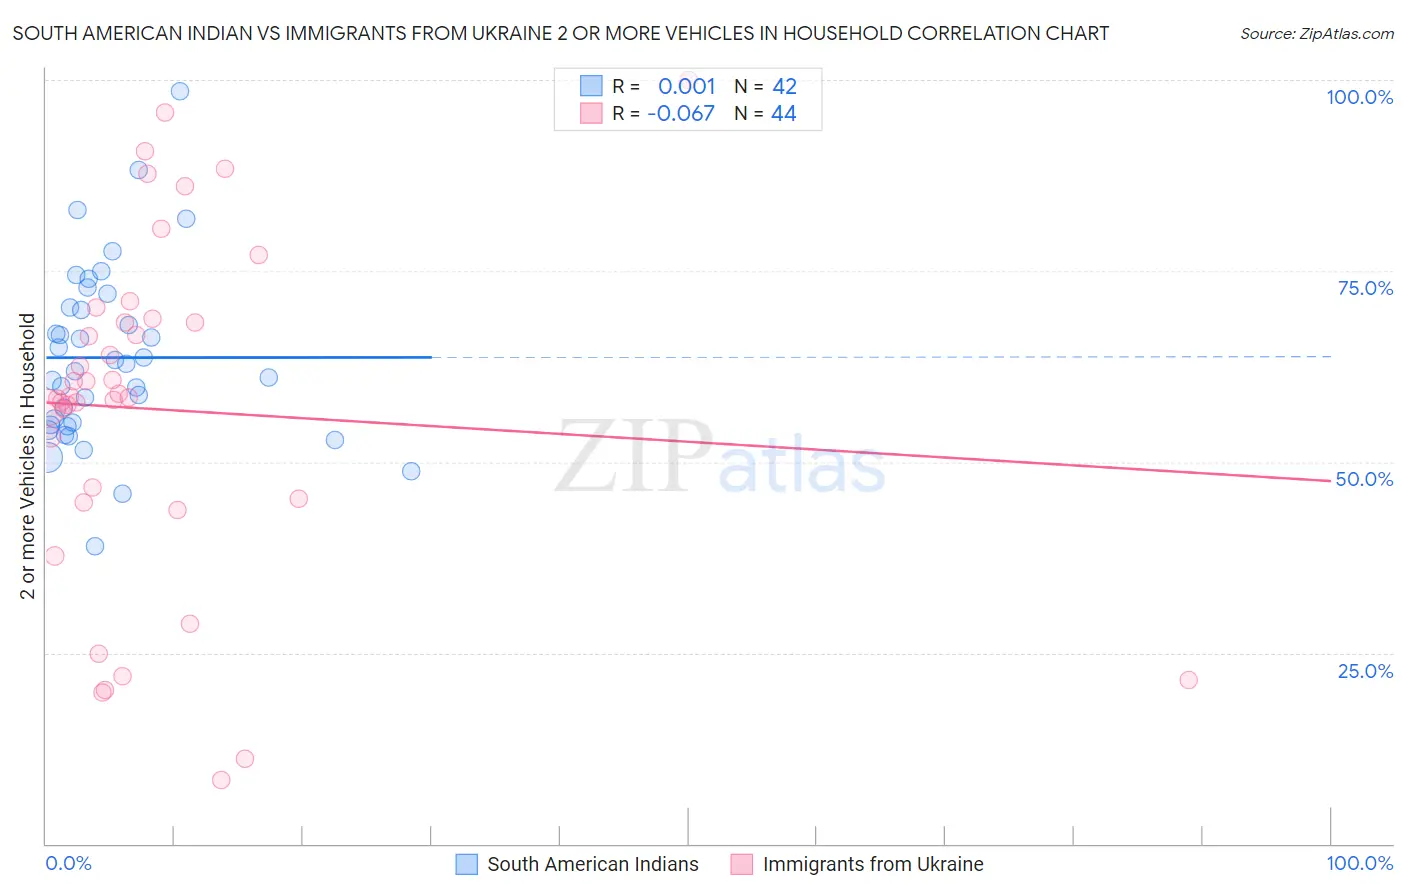
South American Indian vs Immigrants from Ukraine 2 or more Vehicles in Household Correlation Chart
The statistical analysis conducted on geographies consisting of 164,540,449 people shows no correlation between the proportion of South American Indians and percentage of households with 2 or more vehicles available in the United States with a correlation coefficient (R) of 0.001 and weighted average of 53.9%. Similarly, the statistical analysis conducted on geographies consisting of 289,653,727 people shows a slight negative correlation between the proportion of Immigrants from Ukraine and percentage of households with 2 or more vehicles available in the United States with a correlation coefficient (R) of -0.067 and weighted average of 50.9%, a difference of 5.9%.
2 or more Vehicles in Household Correlation Summary
| Measurement | South American Indian | Immigrants from Ukraine |
| Minimum | 38.9% | 8.3% |
| Maximum | 98.5% | 100.0% |
| Range | 59.6% | 91.7% |
| Mean | 63.7% | 56.8% |
| Median | 62.4% | 58.5% |
| Interquartile 25% (IQ1) | 54.8% | 45.0% |
| Interquartile 75% (IQ3) | 70.2% | 68.5% |
| Interquartile Range (IQR) | 15.4% | 23.6% |
| Standard Deviation (Sample) | 11.8% | 22.5% |
| Standard Deviation (Population) | 11.6% | 22.3% |
Similar Demographics by 2 or more Vehicles in Household
Demographics Similar to South American Indians by 2 or more Vehicles in Household
In terms of 2 or more vehicles in household, the demographic groups most similar to South American Indians are Taiwanese (53.9%, a difference of 0.020%), Immigrants from Singapore (53.9%, a difference of 0.040%), Kiowa (53.9%, a difference of 0.050%), Immigrants from Argentina (53.9%, a difference of 0.060%), and Immigrants from Burma/Myanmar (53.9%, a difference of 0.11%).
| Demographics | Rating | Rank | 2 or more Vehicles in Household |
| Immigrants | Chile | 11.1 /100 | #212 | Poor 54.2% |
| Guatemalans | 9.6 /100 | #213 | Tragic 54.1% |
| Immigrants | Czechoslovakia | 9.4 /100 | #214 | Tragic 54.1% |
| Aleuts | 9.3 /100 | #215 | Tragic 54.1% |
| Immigrants | Western Asia | 9.3 /100 | #216 | Tragic 54.1% |
| Immigrants | Burma/Myanmar | 7.1 /100 | #217 | Tragic 53.9% |
| Immigrants | Argentina | 6.8 /100 | #218 | Tragic 53.9% |
| South American Indians | 6.5 /100 | #219 | Tragic 53.9% |
| Taiwanese | 6.3 /100 | #220 | Tragic 53.9% |
| Immigrants | Singapore | 6.3 /100 | #221 | Tragic 53.9% |
| Kiowa | 6.2 /100 | #222 | Tragic 53.9% |
| Immigrants | Bosnia and Herzegovina | 5.5 /100 | #223 | Tragic 53.8% |
| Brazilians | 5.3 /100 | #224 | Tragic 53.8% |
| Immigrants | Egypt | 5.2 /100 | #225 | Tragic 53.8% |
| Immigrants | Eastern Africa | 5.1 /100 | #226 | Tragic 53.7% |
Demographics Similar to Immigrants from Ukraine by 2 or more Vehicles in Household
In terms of 2 or more vehicles in household, the demographic groups most similar to Immigrants from Ukraine are Black/African American (50.9%, a difference of 0.0%), Belizean (51.0%, a difference of 0.33%), Immigrants from Panama (51.1%, a difference of 0.36%), Somali (51.1%, a difference of 0.43%), and Bermudan (50.6%, a difference of 0.56%).
| Demographics | Rating | Rank | 2 or more Vehicles in Household |
| Immigrants | Uruguay | 0.1 /100 | #285 | Tragic 51.4% |
| Immigrants | Liberia | 0.1 /100 | #286 | Tragic 51.3% |
| Immigrants | Serbia | 0.1 /100 | #287 | Tragic 51.3% |
| Okinawans | 0.1 /100 | #288 | Tragic 51.2% |
| Somalis | 0.0 /100 | #289 | Tragic 51.1% |
| Immigrants | Panama | 0.0 /100 | #290 | Tragic 51.1% |
| Belizeans | 0.0 /100 | #291 | Tragic 51.0% |
| Immigrants | Ukraine | 0.0 /100 | #292 | Tragic 50.9% |
| Blacks/African Americans | 0.0 /100 | #293 | Tragic 50.9% |
| Bermudans | 0.0 /100 | #294 | Tragic 50.6% |
| Cypriots | 0.0 /100 | #295 | Tragic 50.6% |
| Immigrants | Somalia | 0.0 /100 | #296 | Tragic 50.5% |
| Immigrants | Spain | 0.0 /100 | #297 | Tragic 50.4% |
| Paraguayans | 0.0 /100 | #298 | Tragic 50.3% |
| Immigrants | Morocco | 0.0 /100 | #299 | Tragic 50.3% |