Carpatho Rusyn vs Immigrants from Ukraine 2 or more Vehicles in Household
COMPARE
Carpatho Rusyn
Immigrants from Ukraine
2 or more Vehicles in Household
2 or more Vehicles in Household Comparison
Carpatho Rusyns
Immigrants from Ukraine
54.4%
2 OR MORE VEHICLES IN HOUSEHOLD
16.2/ 100
METRIC RATING
198th/ 347
METRIC RANK
50.9%
2 OR MORE VEHICLES IN HOUSEHOLD
0.0/ 100
METRIC RATING
292nd/ 347
METRIC RANK
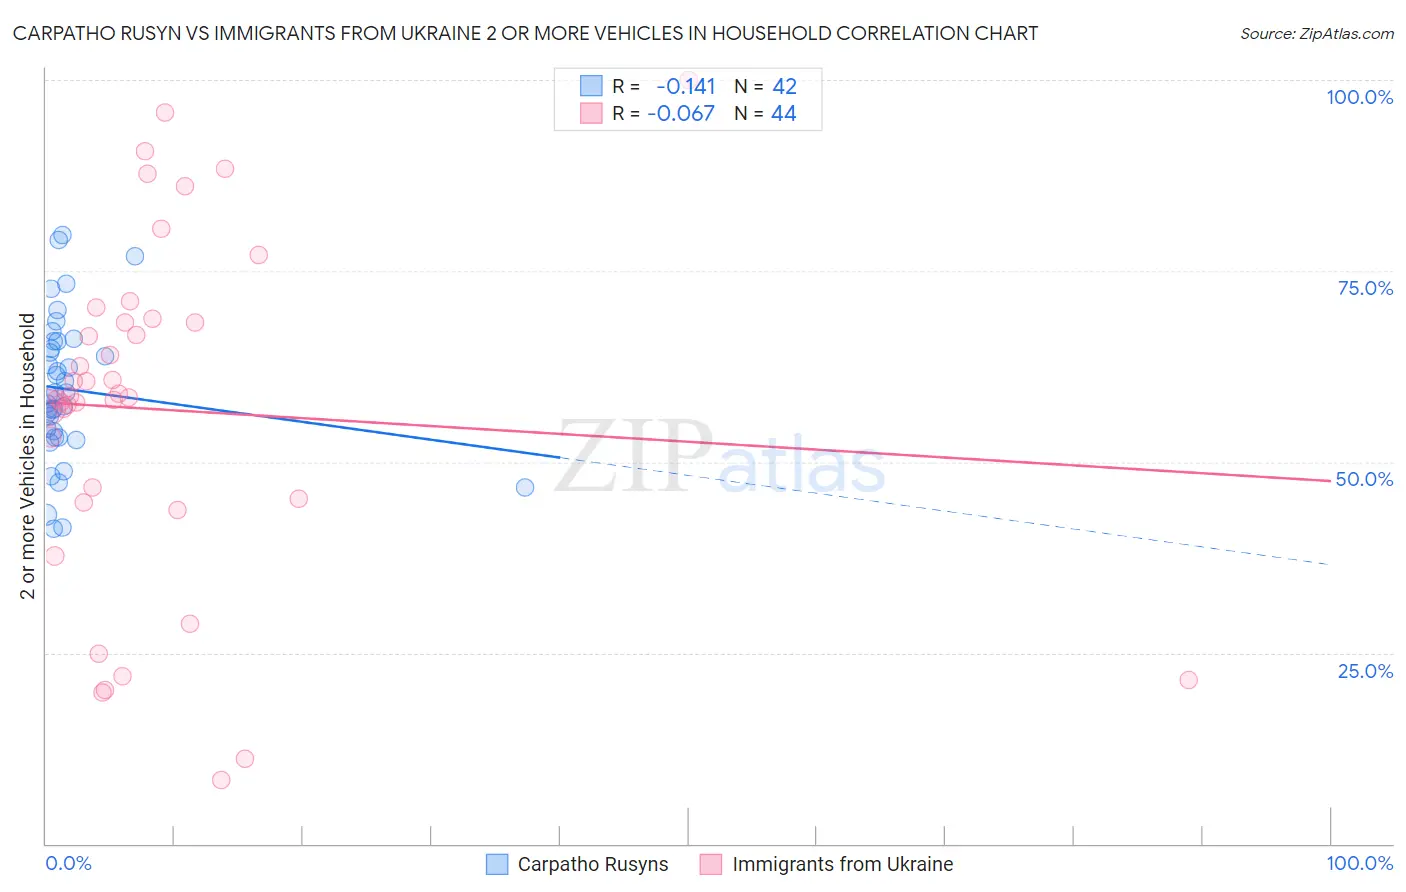
Carpatho Rusyn vs Immigrants from Ukraine 2 or more Vehicles in Household Correlation Chart
The statistical analysis conducted on geographies consisting of 58,871,690 people shows a poor negative correlation between the proportion of Carpatho Rusyns and percentage of households with 2 or more vehicles available in the United States with a correlation coefficient (R) of -0.141 and weighted average of 54.4%. Similarly, the statistical analysis conducted on geographies consisting of 289,653,727 people shows a slight negative correlation between the proportion of Immigrants from Ukraine and percentage of households with 2 or more vehicles available in the United States with a correlation coefficient (R) of -0.067 and weighted average of 50.9%, a difference of 7.0%.
2 or more Vehicles in Household Correlation Summary
| Measurement | Carpatho Rusyn | Immigrants from Ukraine |
| Minimum | 41.3% | 8.3% |
| Maximum | 79.7% | 100.0% |
| Range | 38.5% | 91.7% |
| Mean | 59.5% | 56.8% |
| Median | 58.9% | 58.5% |
| Interquartile 25% (IQ1) | 53.2% | 45.0% |
| Interquartile 75% (IQ3) | 65.8% | 68.5% |
| Interquartile Range (IQR) | 12.6% | 23.6% |
| Standard Deviation (Sample) | 9.5% | 22.5% |
| Standard Deviation (Population) | 9.4% | 22.3% |
Similar Demographics by 2 or more Vehicles in Household
Demographics Similar to Carpatho Rusyns by 2 or more Vehicles in Household
In terms of 2 or more vehicles in household, the demographic groups most similar to Carpatho Rusyns are Immigrants from Norway (54.4%, a difference of 0.030%), Houma (54.4%, a difference of 0.030%), Immigrants from Italy (54.4%, a difference of 0.060%), Argentinean (54.5%, a difference of 0.090%), and Immigrants from North Macedonia (54.4%, a difference of 0.11%).
| Demographics | Rating | Rank | 2 or more Vehicles in Household |
| Immigrants | Immigrants | 25.0 /100 | #191 | Fair 54.7% |
| Immigrants | Romania | 23.8 /100 | #192 | Fair 54.7% |
| Immigrants | Japan | 23.4 /100 | #193 | Fair 54.7% |
| Central Americans | 23.0 /100 | #194 | Fair 54.7% |
| Iroquois | 22.6 /100 | #195 | Fair 54.7% |
| Immigrants | Poland | 19.3 /100 | #196 | Poor 54.6% |
| Argentineans | 17.5 /100 | #197 | Poor 54.5% |
| Carpatho Rusyns | 16.2 /100 | #198 | Poor 54.4% |
| Immigrants | Norway | 15.9 /100 | #199 | Poor 54.4% |
| Houma | 15.8 /100 | #200 | Poor 54.4% |
| Immigrants | Italy | 15.5 /100 | #201 | Poor 54.4% |
| Immigrants | North Macedonia | 14.9 /100 | #202 | Poor 54.4% |
| Immigrants | Peru | 14.3 /100 | #203 | Poor 54.4% |
| Immigrants | Belgium | 13.7 /100 | #204 | Poor 54.3% |
| Cheyenne | 13.6 /100 | #205 | Poor 54.3% |
Demographics Similar to Immigrants from Ukraine by 2 or more Vehicles in Household
In terms of 2 or more vehicles in household, the demographic groups most similar to Immigrants from Ukraine are Black/African American (50.9%, a difference of 0.0%), Belizean (51.0%, a difference of 0.33%), Immigrants from Panama (51.1%, a difference of 0.36%), Somali (51.1%, a difference of 0.43%), and Bermudan (50.6%, a difference of 0.56%).
| Demographics | Rating | Rank | 2 or more Vehicles in Household |
| Immigrants | Uruguay | 0.1 /100 | #285 | Tragic 51.4% |
| Immigrants | Liberia | 0.1 /100 | #286 | Tragic 51.3% |
| Immigrants | Serbia | 0.1 /100 | #287 | Tragic 51.3% |
| Okinawans | 0.1 /100 | #288 | Tragic 51.2% |
| Somalis | 0.0 /100 | #289 | Tragic 51.1% |
| Immigrants | Panama | 0.0 /100 | #290 | Tragic 51.1% |
| Belizeans | 0.0 /100 | #291 | Tragic 51.0% |
| Immigrants | Ukraine | 0.0 /100 | #292 | Tragic 50.9% |
| Blacks/African Americans | 0.0 /100 | #293 | Tragic 50.9% |
| Bermudans | 0.0 /100 | #294 | Tragic 50.6% |
| Cypriots | 0.0 /100 | #295 | Tragic 50.6% |
| Immigrants | Somalia | 0.0 /100 | #296 | Tragic 50.5% |
| Immigrants | Spain | 0.0 /100 | #297 | Tragic 50.4% |
| Paraguayans | 0.0 /100 | #298 | Tragic 50.3% |
| Immigrants | Morocco | 0.0 /100 | #299 | Tragic 50.3% |