South American Indian vs Immigrants from Northern Europe 2 or more Vehicles in Household
COMPARE
South American Indian
Immigrants from Northern Europe
2 or more Vehicles in Household
2 or more Vehicles in Household Comparison
South American Indians
Immigrants from Northern Europe
53.9%
2 OR MORE VEHICLES IN HOUSEHOLD
6.5/ 100
METRIC RATING
219th/ 347
METRIC RANK
56.1%
2 OR MORE VEHICLES IN HOUSEHOLD
78.7/ 100
METRIC RATING
151st/ 347
METRIC RANK
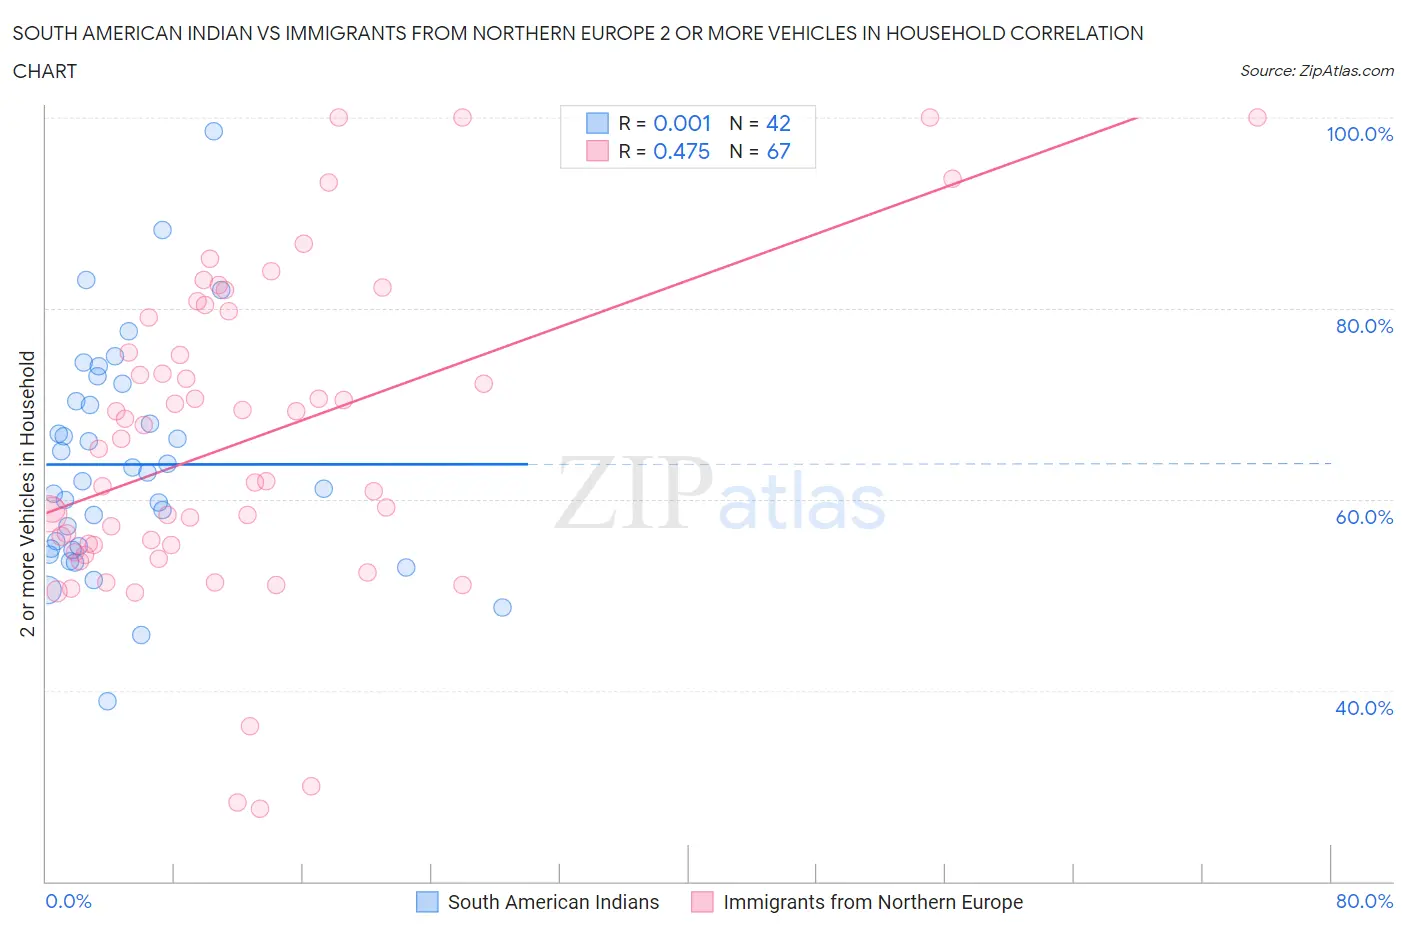
South American Indian vs Immigrants from Northern Europe 2 or more Vehicles in Household Correlation Chart
The statistical analysis conducted on geographies consisting of 164,540,449 people shows no correlation between the proportion of South American Indians and percentage of households with 2 or more vehicles available in the United States with a correlation coefficient (R) of 0.001 and weighted average of 53.9%. Similarly, the statistical analysis conducted on geographies consisting of 476,975,889 people shows a moderate positive correlation between the proportion of Immigrants from Northern Europe and percentage of households with 2 or more vehicles available in the United States with a correlation coefficient (R) of 0.475 and weighted average of 56.1%, a difference of 4.1%.
2 or more Vehicles in Household Correlation Summary
| Measurement | South American Indian | Immigrants from Northern Europe |
| Minimum | 38.9% | 27.6% |
| Maximum | 98.5% | 100.0% |
| Range | 59.6% | 72.4% |
| Mean | 63.7% | 66.1% |
| Median | 62.4% | 65.3% |
| Interquartile 25% (IQ1) | 54.8% | 55.2% |
| Interquartile 75% (IQ3) | 70.2% | 79.1% |
| Interquartile Range (IQR) | 15.4% | 23.9% |
| Standard Deviation (Sample) | 11.8% | 16.6% |
| Standard Deviation (Population) | 11.6% | 16.5% |
Similar Demographics by 2 or more Vehicles in Household
Demographics Similar to South American Indians by 2 or more Vehicles in Household
In terms of 2 or more vehicles in household, the demographic groups most similar to South American Indians are Taiwanese (53.9%, a difference of 0.020%), Immigrants from Singapore (53.9%, a difference of 0.040%), Kiowa (53.9%, a difference of 0.050%), Immigrants from Argentina (53.9%, a difference of 0.060%), and Immigrants from Burma/Myanmar (53.9%, a difference of 0.11%).
| Demographics | Rating | Rank | 2 or more Vehicles in Household |
| Immigrants | Chile | 11.1 /100 | #212 | Poor 54.2% |
| Guatemalans | 9.6 /100 | #213 | Tragic 54.1% |
| Immigrants | Czechoslovakia | 9.4 /100 | #214 | Tragic 54.1% |
| Aleuts | 9.3 /100 | #215 | Tragic 54.1% |
| Immigrants | Western Asia | 9.3 /100 | #216 | Tragic 54.1% |
| Immigrants | Burma/Myanmar | 7.1 /100 | #217 | Tragic 53.9% |
| Immigrants | Argentina | 6.8 /100 | #218 | Tragic 53.9% |
| South American Indians | 6.5 /100 | #219 | Tragic 53.9% |
| Taiwanese | 6.3 /100 | #220 | Tragic 53.9% |
| Immigrants | Singapore | 6.3 /100 | #221 | Tragic 53.9% |
| Kiowa | 6.2 /100 | #222 | Tragic 53.9% |
| Immigrants | Bosnia and Herzegovina | 5.5 /100 | #223 | Tragic 53.8% |
| Brazilians | 5.3 /100 | #224 | Tragic 53.8% |
| Immigrants | Egypt | 5.2 /100 | #225 | Tragic 53.8% |
| Immigrants | Eastern Africa | 5.1 /100 | #226 | Tragic 53.7% |
Demographics Similar to Immigrants from Northern Europe by 2 or more Vehicles in Household
In terms of 2 or more vehicles in household, the demographic groups most similar to Immigrants from Northern Europe are Immigrants from Pakistan (56.1%, a difference of 0.030%), Nicaraguan (56.1%, a difference of 0.070%), Immigrants from Moldova (56.1%, a difference of 0.090%), Chilean (56.1%, a difference of 0.090%), and Serbian (56.1%, a difference of 0.10%).
| Demographics | Rating | Rank | 2 or more Vehicles in Household |
| Immigrants | Syria | 81.4 /100 | #144 | Excellent 56.2% |
| Syrians | 81.2 /100 | #145 | Excellent 56.2% |
| Venezuelans | 80.7 /100 | #146 | Excellent 56.1% |
| Serbians | 80.3 /100 | #147 | Excellent 56.1% |
| Immigrants | Moldova | 80.2 /100 | #148 | Excellent 56.1% |
| Chileans | 80.2 /100 | #149 | Excellent 56.1% |
| Nicaraguans | 79.9 /100 | #150 | Good 56.1% |
| Immigrants | Northern Europe | 78.7 /100 | #151 | Good 56.1% |
| Immigrants | Pakistan | 78.1 /100 | #152 | Good 56.1% |
| Lumbee | 71.9 /100 | #153 | Good 55.9% |
| Ukrainians | 70.8 /100 | #154 | Good 55.8% |
| Immigrants | Venezuela | 70.7 /100 | #155 | Good 55.8% |
| Immigrants | Lithuania | 70.4 /100 | #156 | Good 55.8% |
| Immigrants | Kuwait | 70.2 /100 | #157 | Good 55.8% |
| Tlingit-Haida | 68.5 /100 | #158 | Good 55.8% |