Immigrants from Australia vs Immigrants from Ukraine 2 or more Vehicles in Household
COMPARE
Immigrants from Australia
Immigrants from Ukraine
2 or more Vehicles in Household
2 or more Vehicles in Household Comparison
Immigrants from Australia
Immigrants from Ukraine
52.4%
2 OR MORE VEHICLES IN HOUSEHOLD
0.5/ 100
METRIC RATING
261st/ 347
METRIC RANK
50.9%
2 OR MORE VEHICLES IN HOUSEHOLD
0.0/ 100
METRIC RATING
292nd/ 347
METRIC RANK
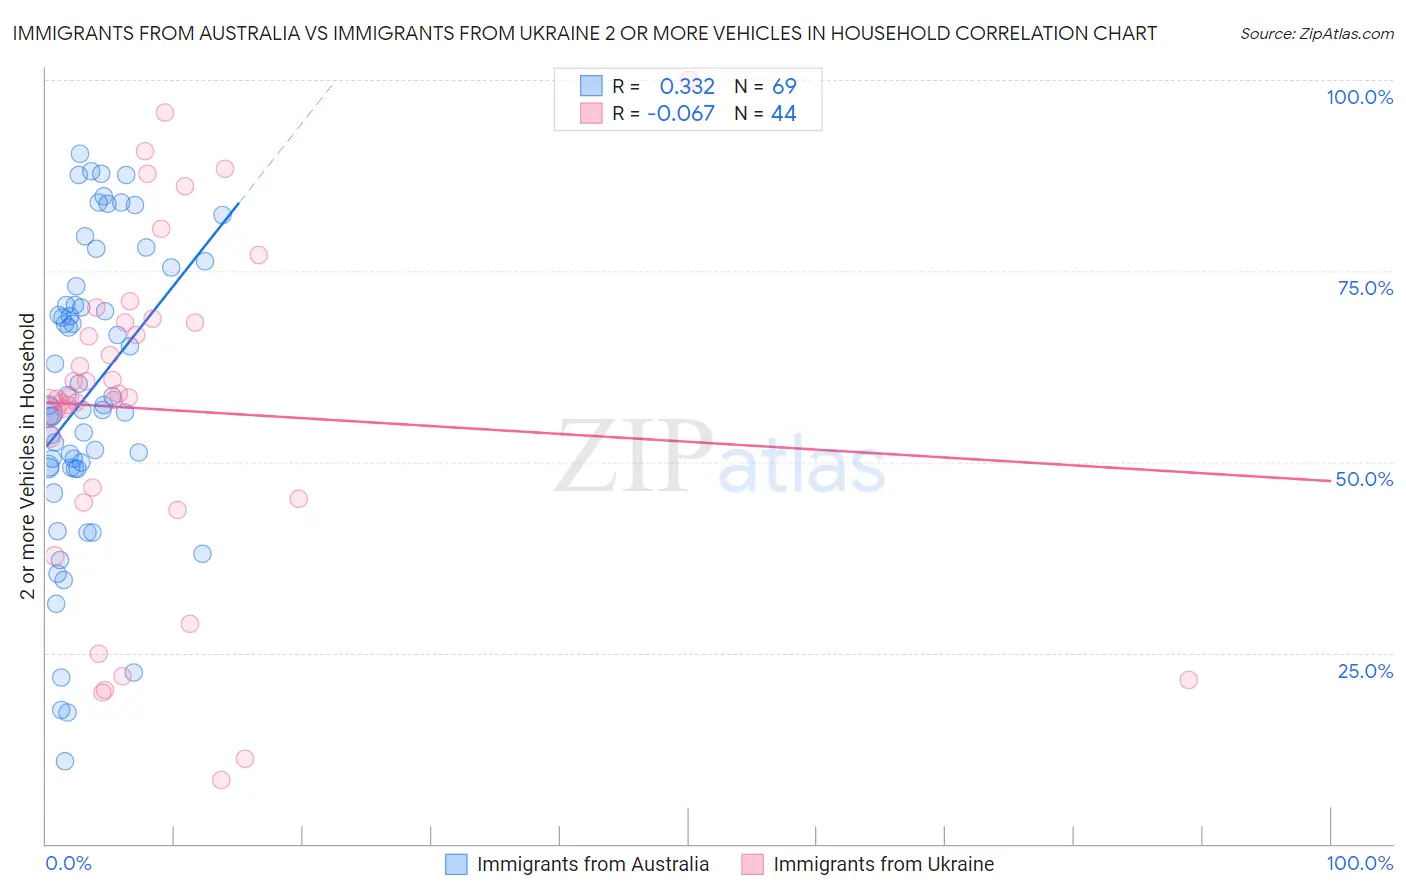
Immigrants from Australia vs Immigrants from Ukraine 2 or more Vehicles in Household Correlation Chart
The statistical analysis conducted on geographies consisting of 227,142,771 people shows a mild positive correlation between the proportion of Immigrants from Australia and percentage of households with 2 or more vehicles available in the United States with a correlation coefficient (R) of 0.332 and weighted average of 52.4%. Similarly, the statistical analysis conducted on geographies consisting of 289,653,727 people shows a slight negative correlation between the proportion of Immigrants from Ukraine and percentage of households with 2 or more vehicles available in the United States with a correlation coefficient (R) of -0.067 and weighted average of 50.9%, a difference of 3.1%.
2 or more Vehicles in Household Correlation Summary
| Measurement | Immigrants from Australia | Immigrants from Ukraine |
| Minimum | 10.8% | 8.3% |
| Maximum | 90.4% | 100.0% |
| Range | 79.7% | 91.7% |
| Mean | 58.9% | 56.8% |
| Median | 57.4% | 58.5% |
| Interquartile 25% (IQ1) | 49.3% | 45.0% |
| Interquartile 75% (IQ3) | 71.8% | 68.5% |
| Interquartile Range (IQR) | 22.5% | 23.6% |
| Standard Deviation (Sample) | 19.0% | 22.5% |
| Standard Deviation (Population) | 18.9% | 22.3% |
Similar Demographics by 2 or more Vehicles in Household
Demographics Similar to Immigrants from Australia by 2 or more Vehicles in Household
In terms of 2 or more vehicles in household, the demographic groups most similar to Immigrants from Australia are Immigrants from Bahamas (52.5%, a difference of 0.030%), Alsatian (52.5%, a difference of 0.10%), Central American Indian (52.5%, a difference of 0.14%), Immigrants from Northern Africa (52.3%, a difference of 0.20%), and Immigrants from Hong Kong (52.6%, a difference of 0.24%).
| Demographics | Rating | Rank | 2 or more Vehicles in Household |
| Immigrants | Malaysia | 0.8 /100 | #254 | Tragic 52.7% |
| Uruguayans | 0.7 /100 | #255 | Tragic 52.7% |
| Immigrants | Eritrea | 0.7 /100 | #256 | Tragic 52.6% |
| Immigrants | Hong Kong | 0.6 /100 | #257 | Tragic 52.6% |
| Central American Indians | 0.6 /100 | #258 | Tragic 52.5% |
| Alsatians | 0.6 /100 | #259 | Tragic 52.5% |
| Immigrants | Bahamas | 0.5 /100 | #260 | Tragic 52.5% |
| Immigrants | Australia | 0.5 /100 | #261 | Tragic 52.4% |
| Immigrants | Northern Africa | 0.4 /100 | #262 | Tragic 52.3% |
| Immigrants | Southern Europe | 0.4 /100 | #263 | Tragic 52.3% |
| Immigrants | Latvia | 0.4 /100 | #264 | Tragic 52.2% |
| Immigrants | Congo | 0.3 /100 | #265 | Tragic 52.1% |
| Immigrants | France | 0.2 /100 | #266 | Tragic 52.0% |
| Immigrants | Colombia | 0.2 /100 | #267 | Tragic 52.0% |
| Pima | 0.2 /100 | #268 | Tragic 52.0% |
Demographics Similar to Immigrants from Ukraine by 2 or more Vehicles in Household
In terms of 2 or more vehicles in household, the demographic groups most similar to Immigrants from Ukraine are Black/African American (50.9%, a difference of 0.0%), Belizean (51.0%, a difference of 0.33%), Immigrants from Panama (51.1%, a difference of 0.36%), Somali (51.1%, a difference of 0.43%), and Bermudan (50.6%, a difference of 0.56%).
| Demographics | Rating | Rank | 2 or more Vehicles in Household |
| Immigrants | Uruguay | 0.1 /100 | #285 | Tragic 51.4% |
| Immigrants | Liberia | 0.1 /100 | #286 | Tragic 51.3% |
| Immigrants | Serbia | 0.1 /100 | #287 | Tragic 51.3% |
| Okinawans | 0.1 /100 | #288 | Tragic 51.2% |
| Somalis | 0.0 /100 | #289 | Tragic 51.1% |
| Immigrants | Panama | 0.0 /100 | #290 | Tragic 51.1% |
| Belizeans | 0.0 /100 | #291 | Tragic 51.0% |
| Immigrants | Ukraine | 0.0 /100 | #292 | Tragic 50.9% |
| Blacks/African Americans | 0.0 /100 | #293 | Tragic 50.9% |
| Bermudans | 0.0 /100 | #294 | Tragic 50.6% |
| Cypriots | 0.0 /100 | #295 | Tragic 50.6% |
| Immigrants | Somalia | 0.0 /100 | #296 | Tragic 50.5% |
| Immigrants | Spain | 0.0 /100 | #297 | Tragic 50.4% |
| Paraguayans | 0.0 /100 | #298 | Tragic 50.3% |
| Immigrants | Morocco | 0.0 /100 | #299 | Tragic 50.3% |