South American Indian vs Immigrants from Ukraine Births to Unmarried Women
COMPARE
South American Indian
Immigrants from Ukraine
Births to Unmarried Women
Births to Unmarried Women Comparison
South American Indians
Immigrants from Ukraine
31.7%
BIRTHS TO UNMARRIED WOMEN
47.7/ 100
METRIC RATING
177th/ 347
METRIC RANK
27.2%
BIRTHS TO UNMARRIED WOMEN
99.7/ 100
METRIC RATING
37th/ 347
METRIC RANK
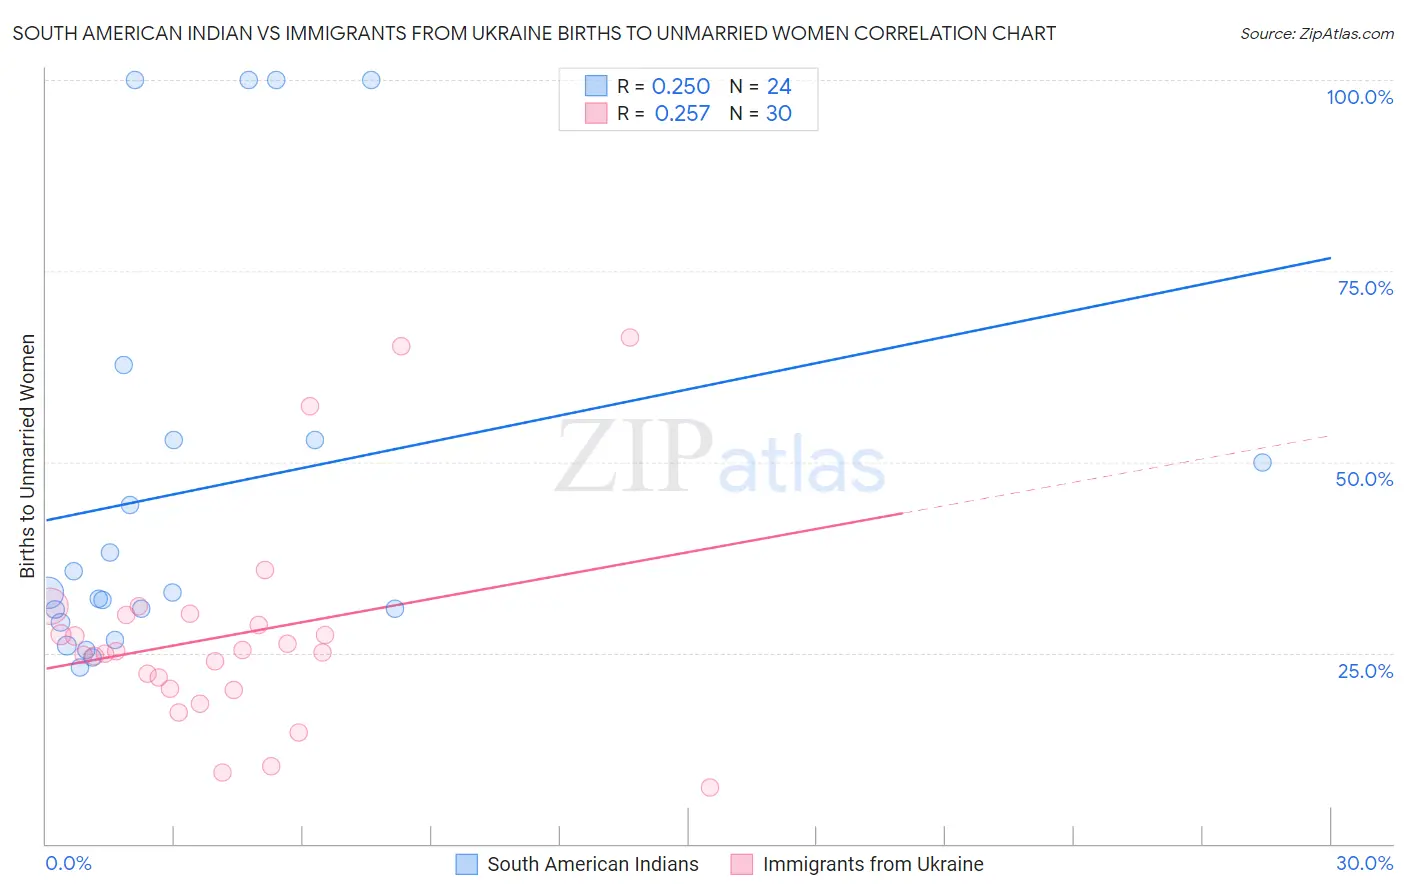
South American Indian vs Immigrants from Ukraine Births to Unmarried Women Correlation Chart
The statistical analysis conducted on geographies consisting of 159,564,044 people shows a weak positive correlation between the proportion of South American Indians and percentage of births to unmarried women in the United States with a correlation coefficient (R) of 0.250 and weighted average of 31.7%. Similarly, the statistical analysis conducted on geographies consisting of 271,328,047 people shows a weak positive correlation between the proportion of Immigrants from Ukraine and percentage of births to unmarried women in the United States with a correlation coefficient (R) of 0.257 and weighted average of 27.2%, a difference of 16.5%.
Births to Unmarried Women Correlation Summary
| Measurement | South American Indian | Immigrants from Ukraine |
| Minimum | 23.0% | 7.4% |
| Maximum | 100.0% | 66.3% |
| Range | 77.0% | 58.9% |
| Mean | 46.4% | 27.3% |
| Median | 32.9% | 25.1% |
| Interquartile 25% (IQ1) | 29.9% | 20.3% |
| Interquartile 75% (IQ3) | 52.9% | 30.0% |
| Interquartile Range (IQR) | 23.0% | 9.7% |
| Standard Deviation (Sample) | 26.5% | 13.8% |
| Standard Deviation (Population) | 25.9% | 13.6% |
Similar Demographics by Births to Unmarried Women
Demographics Similar to South American Indians by Births to Unmarried Women
In terms of births to unmarried women, the demographic groups most similar to South American Indians are English (31.7%, a difference of 0.030%), Scottish (31.7%, a difference of 0.040%), South American (31.8%, a difference of 0.070%), Immigrants from Venezuela (31.7%, a difference of 0.14%), and Moroccan (31.8%, a difference of 0.18%).
| Demographics | Rating | Rank | Births to Unmarried Women |
| Guamanians/Chamorros | 51.3 /100 | #170 | Average 31.6% |
| Finns | 50.5 /100 | #171 | Average 31.7% |
| Immigrants | Eritrea | 50.4 /100 | #172 | Average 31.7% |
| Immigrants | Yemen | 50.2 /100 | #173 | Average 31.7% |
| Venezuelans | 50.0 /100 | #174 | Average 31.7% |
| Immigrants | Venezuela | 49.2 /100 | #175 | Average 31.7% |
| Scottish | 48.1 /100 | #176 | Average 31.7% |
| South American Indians | 47.7 /100 | #177 | Average 31.7% |
| English | 47.4 /100 | #178 | Average 31.7% |
| South Americans | 46.9 /100 | #179 | Average 31.8% |
| Moroccans | 45.7 /100 | #180 | Average 31.8% |
| Immigrants | Peru | 45.1 /100 | #181 | Average 31.8% |
| Kenyans | 43.0 /100 | #182 | Average 31.9% |
| Canadians | 41.4 /100 | #183 | Average 31.9% |
| Immigrants | South America | 40.7 /100 | #184 | Average 32.0% |
Demographics Similar to Immigrants from Ukraine by Births to Unmarried Women
In terms of births to unmarried women, the demographic groups most similar to Immigrants from Ukraine are Immigrants from Western Asia (27.2%, a difference of 0.090%), Immigrants from Moldova (27.3%, a difference of 0.14%), Immigrants from Ireland (27.2%, a difference of 0.16%), Immigrants from Pakistan (27.2%, a difference of 0.23%), and Immigrants from Sri Lanka (27.2%, a difference of 0.28%).
| Demographics | Rating | Rank | Births to Unmarried Women |
| Bulgarians | 99.8 /100 | #30 | Exceptional 27.1% |
| Immigrants | Iraq | 99.8 /100 | #31 | Exceptional 27.1% |
| Immigrants | Russia | 99.8 /100 | #32 | Exceptional 27.1% |
| Immigrants | Sri Lanka | 99.8 /100 | #33 | Exceptional 27.2% |
| Immigrants | Pakistan | 99.8 /100 | #34 | Exceptional 27.2% |
| Immigrants | Ireland | 99.7 /100 | #35 | Exceptional 27.2% |
| Immigrants | Western Asia | 99.7 /100 | #36 | Exceptional 27.2% |
| Immigrants | Ukraine | 99.7 /100 | #37 | Exceptional 27.2% |
| Immigrants | Moldova | 99.7 /100 | #38 | Exceptional 27.3% |
| Immigrants | Malaysia | 99.7 /100 | #39 | Exceptional 27.4% |
| Turks | 99.6 /100 | #40 | Exceptional 27.4% |
| Iraqis | 99.6 /100 | #41 | Exceptional 27.6% |
| Immigrants | Eastern Europe | 99.6 /100 | #42 | Exceptional 27.6% |
| Immigrants | Bulgaria | 99.6 /100 | #43 | Exceptional 27.6% |
| Immigrants | Indonesia | 99.5 /100 | #44 | Exceptional 27.7% |