South American Indian vs Cambodian 2 or more Vehicles in Household
COMPARE
South American Indian
Cambodian
2 or more Vehicles in Household
2 or more Vehicles in Household Comparison
South American Indians
Cambodians
53.9%
2 OR MORE VEHICLES IN HOUSEHOLD
6.5/ 100
METRIC RATING
219th/ 347
METRIC RANK
53.3%
2 OR MORE VEHICLES IN HOUSEHOLD
2.3/ 100
METRIC RATING
239th/ 347
METRIC RANK
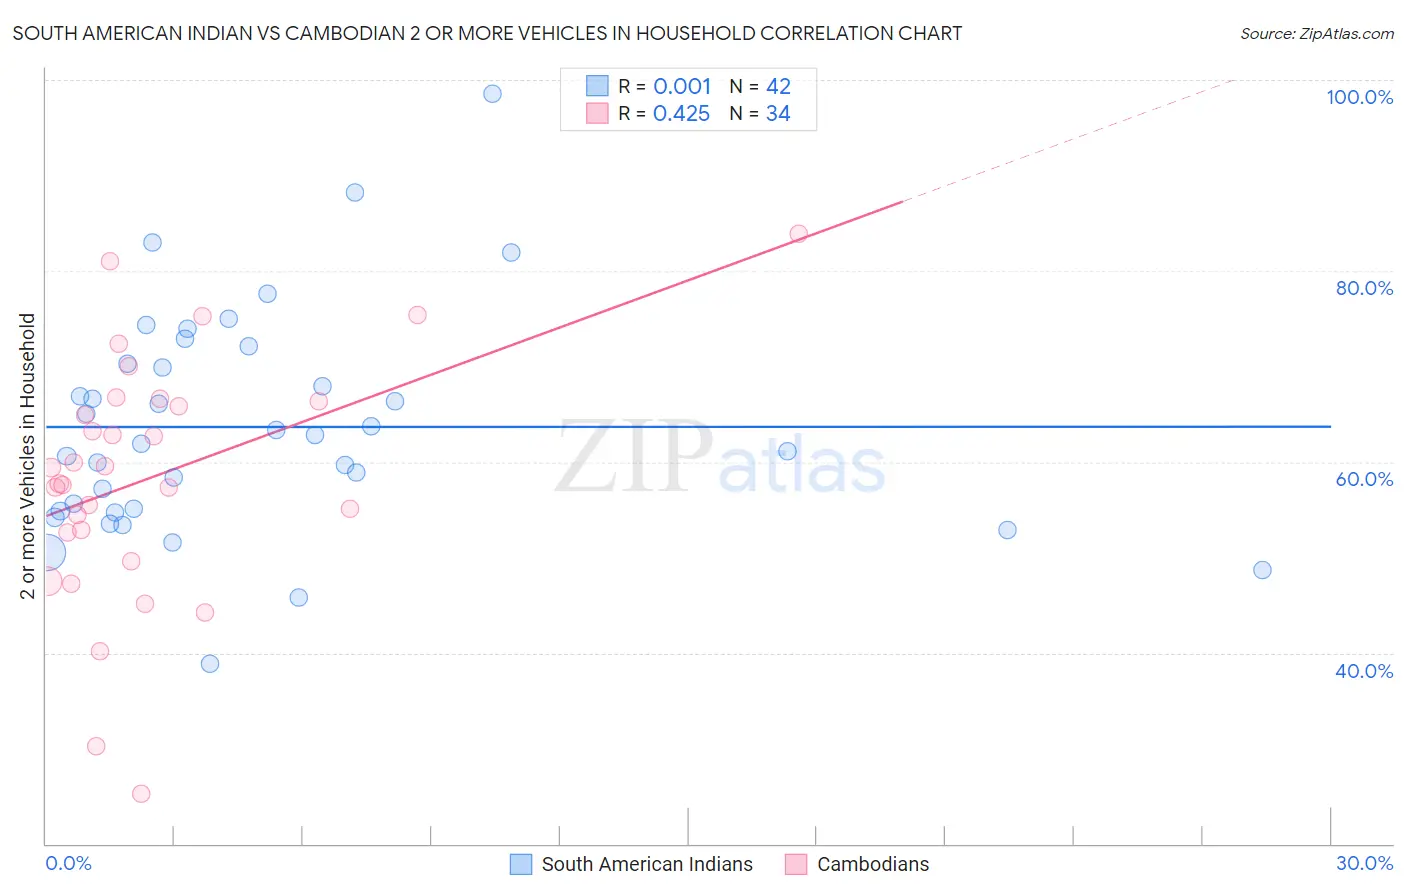
South American Indian vs Cambodian 2 or more Vehicles in Household Correlation Chart
The statistical analysis conducted on geographies consisting of 164,540,449 people shows no correlation between the proportion of South American Indians and percentage of households with 2 or more vehicles available in the United States with a correlation coefficient (R) of 0.001 and weighted average of 53.9%. Similarly, the statistical analysis conducted on geographies consisting of 102,491,174 people shows a moderate positive correlation between the proportion of Cambodians and percentage of households with 2 or more vehicles available in the United States with a correlation coefficient (R) of 0.425 and weighted average of 53.3%, a difference of 1.1%.
2 or more Vehicles in Household Correlation Summary
| Measurement | South American Indian | Cambodian |
| Minimum | 38.9% | 25.3% |
| Maximum | 98.5% | 83.9% |
| Range | 59.6% | 58.6% |
| Mean | 63.7% | 58.4% |
| Median | 62.4% | 58.6% |
| Interquartile 25% (IQ1) | 54.8% | 52.7% |
| Interquartile 75% (IQ3) | 70.2% | 66.4% |
| Interquartile Range (IQR) | 15.4% | 13.8% |
| Standard Deviation (Sample) | 11.8% | 12.9% |
| Standard Deviation (Population) | 11.6% | 12.7% |
Demographics Similar to South American Indians and Cambodians by 2 or more Vehicles in Household
In terms of 2 or more vehicles in household, the demographic groups most similar to South American Indians are Taiwanese (53.9%, a difference of 0.020%), Immigrants from Singapore (53.9%, a difference of 0.040%), Kiowa (53.9%, a difference of 0.050%), Immigrants from Bosnia and Herzegovina (53.8%, a difference of 0.18%), and Brazilian (53.8%, a difference of 0.22%). Similarly, the demographic groups most similar to Cambodians are Immigrants from Armenia (53.3%, a difference of 0.010%), Macedonian (53.3%, a difference of 0.070%), Indonesian (53.4%, a difference of 0.18%), Immigrants from Middle Africa (53.4%, a difference of 0.28%), and Immigrants from Switzerland (53.4%, a difference of 0.31%).
| Demographics | Rating | Rank | 2 or more Vehicles in Household |
| South American Indians | 6.5 /100 | #219 | Tragic 53.9% |
| Taiwanese | 6.3 /100 | #220 | Tragic 53.9% |
| Immigrants | Singapore | 6.3 /100 | #221 | Tragic 53.9% |
| Kiowa | 6.2 /100 | #222 | Tragic 53.9% |
| Immigrants | Bosnia and Herzegovina | 5.5 /100 | #223 | Tragic 53.8% |
| Brazilians | 5.3 /100 | #224 | Tragic 53.8% |
| Immigrants | Egypt | 5.2 /100 | #225 | Tragic 53.8% |
| Immigrants | Eastern Africa | 5.1 /100 | #226 | Tragic 53.7% |
| Sudanese | 4.1 /100 | #227 | Tragic 53.6% |
| Alaska Natives | 3.9 /100 | #228 | Tragic 53.6% |
| Immigrants | Turkey | 3.8 /100 | #229 | Tragic 53.6% |
| Immigrants | Nepal | 3.6 /100 | #230 | Tragic 53.5% |
| Panamanians | 3.4 /100 | #231 | Tragic 53.5% |
| Immigrants | Guatemala | 3.2 /100 | #232 | Tragic 53.5% |
| Ugandans | 3.2 /100 | #233 | Tragic 53.5% |
| Immigrants | Switzerland | 3.0 /100 | #234 | Tragic 53.4% |
| Immigrants | Middle Africa | 3.0 /100 | #235 | Tragic 53.4% |
| Indonesians | 2.7 /100 | #236 | Tragic 53.4% |
| Macedonians | 2.4 /100 | #237 | Tragic 53.3% |
| Immigrants | Armenia | 2.3 /100 | #238 | Tragic 53.3% |
| Cambodians | 2.3 /100 | #239 | Tragic 53.3% |