South American Indian vs Immigrants from North America 2 or more Vehicles in Household
COMPARE
South American Indian
Immigrants from North America
2 or more Vehicles in Household
2 or more Vehicles in Household Comparison
South American Indians
Immigrants from North America
53.9%
2 OR MORE VEHICLES IN HOUSEHOLD
6.5/ 100
METRIC RATING
219th/ 347
METRIC RANK
57.5%
2 OR MORE VEHICLES IN HOUSEHOLD
98.1/ 100
METRIC RATING
109th/ 347
METRIC RANK
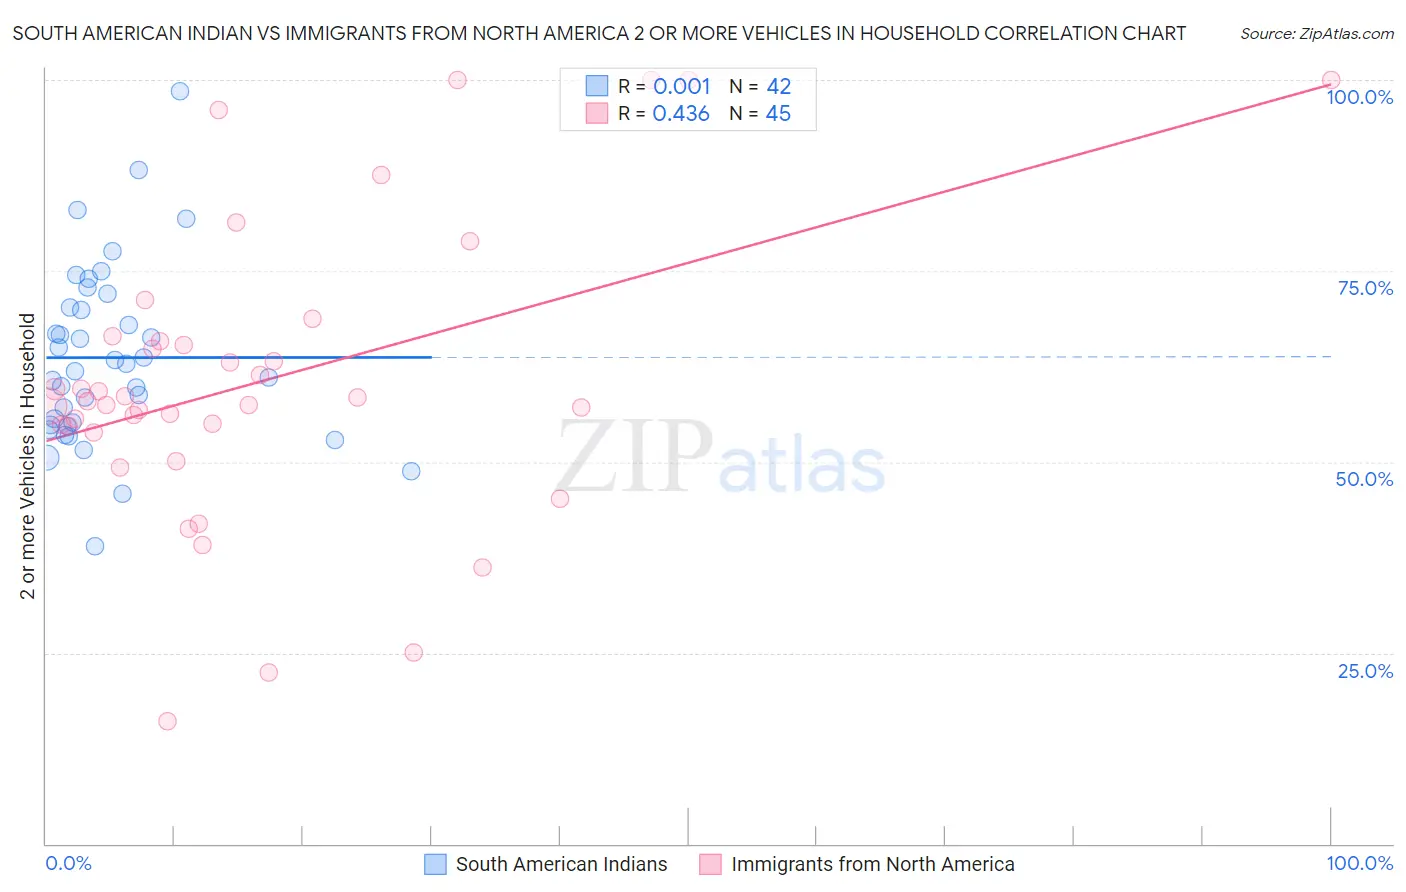
South American Indian vs Immigrants from North America 2 or more Vehicles in Household Correlation Chart
The statistical analysis conducted on geographies consisting of 164,540,449 people shows no correlation between the proportion of South American Indians and percentage of households with 2 or more vehicles available in the United States with a correlation coefficient (R) of 0.001 and weighted average of 53.9%. Similarly, the statistical analysis conducted on geographies consisting of 462,223,821 people shows a moderate positive correlation between the proportion of Immigrants from North America and percentage of households with 2 or more vehicles available in the United States with a correlation coefficient (R) of 0.436 and weighted average of 57.5%, a difference of 6.7%.
2 or more Vehicles in Household Correlation Summary
| Measurement | South American Indian | Immigrants from North America |
| Minimum | 38.9% | 16.0% |
| Maximum | 98.5% | 100.0% |
| Range | 59.6% | 84.0% |
| Mean | 63.7% | 60.6% |
| Median | 62.4% | 58.0% |
| Interquartile 25% (IQ1) | 54.8% | 54.2% |
| Interquartile 75% (IQ3) | 70.2% | 66.1% |
| Interquartile Range (IQR) | 15.4% | 11.9% |
| Standard Deviation (Sample) | 11.8% | 19.4% |
| Standard Deviation (Population) | 11.6% | 19.1% |
Similar Demographics by 2 or more Vehicles in Household
Demographics Similar to South American Indians by 2 or more Vehicles in Household
In terms of 2 or more vehicles in household, the demographic groups most similar to South American Indians are Taiwanese (53.9%, a difference of 0.020%), Immigrants from Singapore (53.9%, a difference of 0.040%), Kiowa (53.9%, a difference of 0.050%), Immigrants from Argentina (53.9%, a difference of 0.060%), and Immigrants from Burma/Myanmar (53.9%, a difference of 0.11%).
| Demographics | Rating | Rank | 2 or more Vehicles in Household |
| Immigrants | Chile | 11.1 /100 | #212 | Poor 54.2% |
| Guatemalans | 9.6 /100 | #213 | Tragic 54.1% |
| Immigrants | Czechoslovakia | 9.4 /100 | #214 | Tragic 54.1% |
| Aleuts | 9.3 /100 | #215 | Tragic 54.1% |
| Immigrants | Western Asia | 9.3 /100 | #216 | Tragic 54.1% |
| Immigrants | Burma/Myanmar | 7.1 /100 | #217 | Tragic 53.9% |
| Immigrants | Argentina | 6.8 /100 | #218 | Tragic 53.9% |
| South American Indians | 6.5 /100 | #219 | Tragic 53.9% |
| Taiwanese | 6.3 /100 | #220 | Tragic 53.9% |
| Immigrants | Singapore | 6.3 /100 | #221 | Tragic 53.9% |
| Kiowa | 6.2 /100 | #222 | Tragic 53.9% |
| Immigrants | Bosnia and Herzegovina | 5.5 /100 | #223 | Tragic 53.8% |
| Brazilians | 5.3 /100 | #224 | Tragic 53.8% |
| Immigrants | Egypt | 5.2 /100 | #225 | Tragic 53.8% |
| Immigrants | Eastern Africa | 5.1 /100 | #226 | Tragic 53.7% |
Demographics Similar to Immigrants from North America by 2 or more Vehicles in Household
In terms of 2 or more vehicles in household, the demographic groups most similar to Immigrants from North America are Japanese (57.5%, a difference of 0.020%), Immigrants from Canada (57.5%, a difference of 0.030%), Immigrants from Netherlands (57.5%, a difference of 0.050%), Greek (57.5%, a difference of 0.050%), and Pueblo (57.5%, a difference of 0.050%).
| Demographics | Rating | Rank | 2 or more Vehicles in Household |
| Immigrants | Bolivia | 98.2 /100 | #102 | Exceptional 57.6% |
| Jordanians | 98.2 /100 | #103 | Exceptional 57.6% |
| Immigrants | Indonesia | 98.2 /100 | #104 | Exceptional 57.6% |
| Immigrants | Korea | 98.2 /100 | #105 | Exceptional 57.6% |
| Immigrants | Oceania | 98.2 /100 | #106 | Exceptional 57.5% |
| Immigrants | Netherlands | 98.2 /100 | #107 | Exceptional 57.5% |
| Immigrants | Canada | 98.1 /100 | #108 | Exceptional 57.5% |
| Immigrants | North America | 98.1 /100 | #109 | Exceptional 57.5% |
| Japanese | 98.0 /100 | #110 | Exceptional 57.5% |
| Greeks | 98.0 /100 | #111 | Exceptional 57.5% |
| Pueblo | 98.0 /100 | #112 | Exceptional 57.5% |
| Zimbabweans | 96.9 /100 | #113 | Exceptional 57.2% |
| Immigrants | Lebanon | 96.8 /100 | #114 | Exceptional 57.2% |
| Chippewa | 96.6 /100 | #115 | Exceptional 57.2% |
| Immigrants | Jordan | 96.6 /100 | #116 | Exceptional 57.2% |