South American Indian vs Bulgarian 2 or more Vehicles in Household
COMPARE
South American Indian
Bulgarian
2 or more Vehicles in Household
2 or more Vehicles in Household Comparison
South American Indians
Bulgarians
53.9%
2 OR MORE VEHICLES IN HOUSEHOLD
6.5/ 100
METRIC RATING
219th/ 347
METRIC RANK
56.5%
2 OR MORE VEHICLES IN HOUSEHOLD
89.7/ 100
METRIC RATING
131st/ 347
METRIC RANK
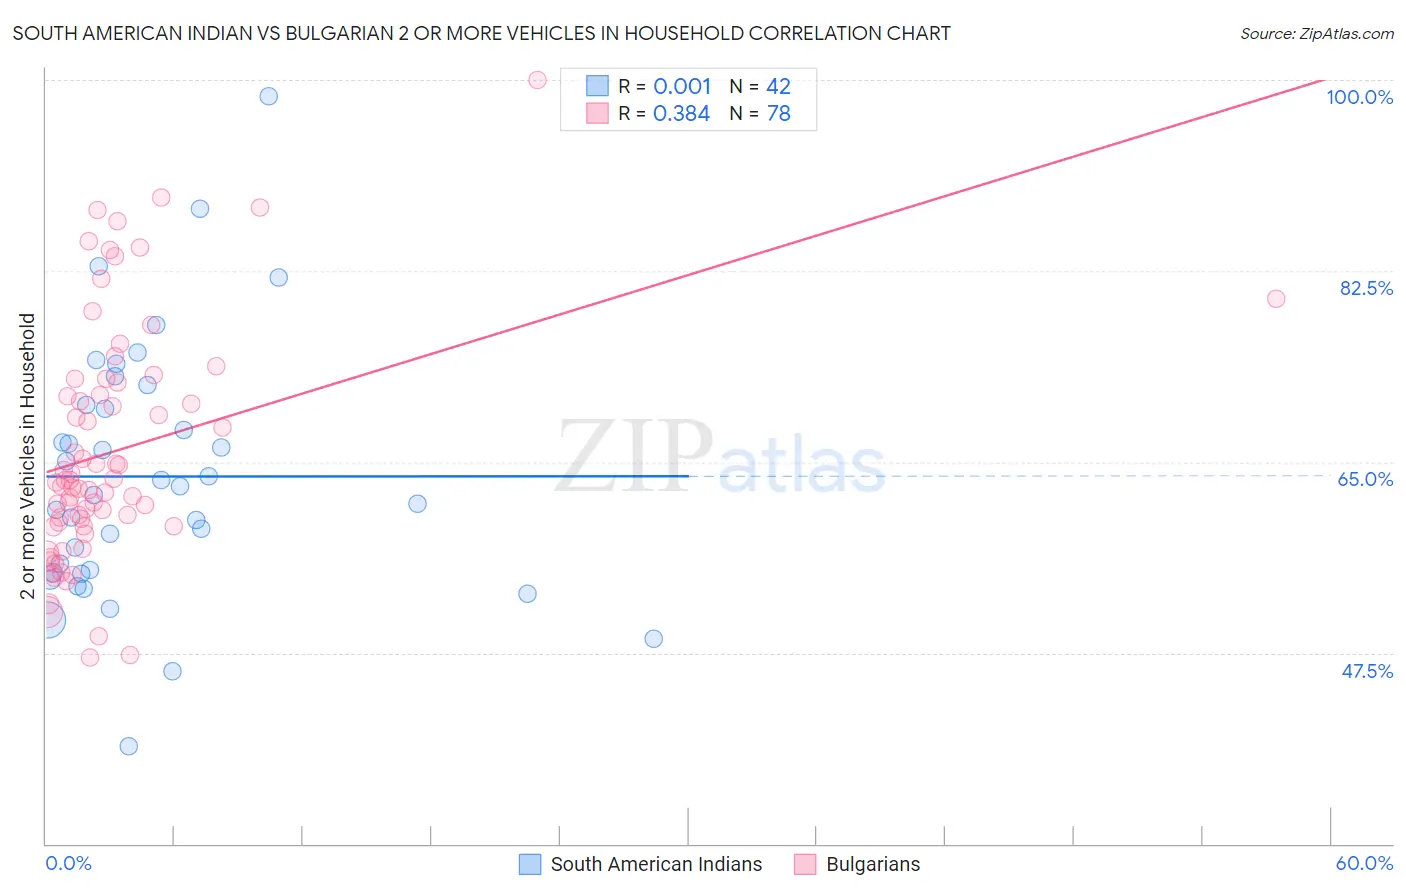
South American Indian vs Bulgarian 2 or more Vehicles in Household Correlation Chart
The statistical analysis conducted on geographies consisting of 164,540,449 people shows no correlation between the proportion of South American Indians and percentage of households with 2 or more vehicles available in the United States with a correlation coefficient (R) of 0.001 and weighted average of 53.9%. Similarly, the statistical analysis conducted on geographies consisting of 205,573,622 people shows a mild positive correlation between the proportion of Bulgarians and percentage of households with 2 or more vehicles available in the United States with a correlation coefficient (R) of 0.384 and weighted average of 56.5%, a difference of 4.9%.
2 or more Vehicles in Household Correlation Summary
| Measurement | South American Indian | Bulgarian |
| Minimum | 38.9% | 47.1% |
| Maximum | 98.5% | 100.0% |
| Range | 59.6% | 52.9% |
| Mean | 63.7% | 66.1% |
| Median | 62.4% | 63.2% |
| Interquartile 25% (IQ1) | 54.8% | 59.1% |
| Interquartile 75% (IQ3) | 70.2% | 72.2% |
| Interquartile Range (IQR) | 15.4% | 13.1% |
| Standard Deviation (Sample) | 11.8% | 10.9% |
| Standard Deviation (Population) | 11.6% | 10.8% |
Similar Demographics by 2 or more Vehicles in Household
Demographics Similar to South American Indians by 2 or more Vehicles in Household
In terms of 2 or more vehicles in household, the demographic groups most similar to South American Indians are Taiwanese (53.9%, a difference of 0.020%), Immigrants from Singapore (53.9%, a difference of 0.040%), Kiowa (53.9%, a difference of 0.050%), Immigrants from Argentina (53.9%, a difference of 0.060%), and Immigrants from Burma/Myanmar (53.9%, a difference of 0.11%).
| Demographics | Rating | Rank | 2 or more Vehicles in Household |
| Immigrants | Chile | 11.1 /100 | #212 | Poor 54.2% |
| Guatemalans | 9.6 /100 | #213 | Tragic 54.1% |
| Immigrants | Czechoslovakia | 9.4 /100 | #214 | Tragic 54.1% |
| Aleuts | 9.3 /100 | #215 | Tragic 54.1% |
| Immigrants | Western Asia | 9.3 /100 | #216 | Tragic 54.1% |
| Immigrants | Burma/Myanmar | 7.1 /100 | #217 | Tragic 53.9% |
| Immigrants | Argentina | 6.8 /100 | #218 | Tragic 53.9% |
| South American Indians | 6.5 /100 | #219 | Tragic 53.9% |
| Taiwanese | 6.3 /100 | #220 | Tragic 53.9% |
| Immigrants | Singapore | 6.3 /100 | #221 | Tragic 53.9% |
| Kiowa | 6.2 /100 | #222 | Tragic 53.9% |
| Immigrants | Bosnia and Herzegovina | 5.5 /100 | #223 | Tragic 53.8% |
| Brazilians | 5.3 /100 | #224 | Tragic 53.8% |
| Immigrants | Egypt | 5.2 /100 | #225 | Tragic 53.8% |
| Immigrants | Eastern Africa | 5.1 /100 | #226 | Tragic 53.7% |
Demographics Similar to Bulgarians by 2 or more Vehicles in Household
In terms of 2 or more vehicles in household, the demographic groups most similar to Bulgarians are Yugoslavian (56.6%, a difference of 0.030%), Hungarian (56.5%, a difference of 0.060%), Ute (56.6%, a difference of 0.070%), Immigrants from South Central Asia (56.6%, a difference of 0.080%), and Immigrants from Thailand (56.6%, a difference of 0.10%).
| Demographics | Rating | Rank | 2 or more Vehicles in Household |
| New Zealanders | 91.8 /100 | #124 | Exceptional 56.7% |
| Tsimshian | 91.6 /100 | #125 | Exceptional 56.7% |
| Estonians | 90.9 /100 | #126 | Exceptional 56.6% |
| Immigrants | Thailand | 90.7 /100 | #127 | Exceptional 56.6% |
| Immigrants | South Central Asia | 90.5 /100 | #128 | Exceptional 56.6% |
| Ute | 90.4 /100 | #129 | Exceptional 56.6% |
| Yugoslavians | 90.0 /100 | #130 | Exceptional 56.6% |
| Bulgarians | 89.7 /100 | #131 | Excellent 56.5% |
| Hungarians | 89.1 /100 | #132 | Excellent 56.5% |
| Comanche | 88.4 /100 | #133 | Excellent 56.5% |
| Immigrants | Azores | 86.6 /100 | #134 | Excellent 56.4% |
| Blackfeet | 86.5 /100 | #135 | Excellent 56.4% |
| Immigrants | Asia | 86.0 /100 | #136 | Excellent 56.3% |
| Cubans | 84.8 /100 | #137 | Excellent 56.3% |
| Salvadorans | 84.7 /100 | #138 | Excellent 56.3% |