South American Indian vs Immigrants from Norway 2 or more Vehicles in Household
COMPARE
South American Indian
Immigrants from Norway
2 or more Vehicles in Household
2 or more Vehicles in Household Comparison
South American Indians
Immigrants from Norway
53.9%
2 OR MORE VEHICLES IN HOUSEHOLD
6.5/ 100
METRIC RATING
219th/ 347
METRIC RANK
54.4%
2 OR MORE VEHICLES IN HOUSEHOLD
15.9/ 100
METRIC RATING
199th/ 347
METRIC RANK
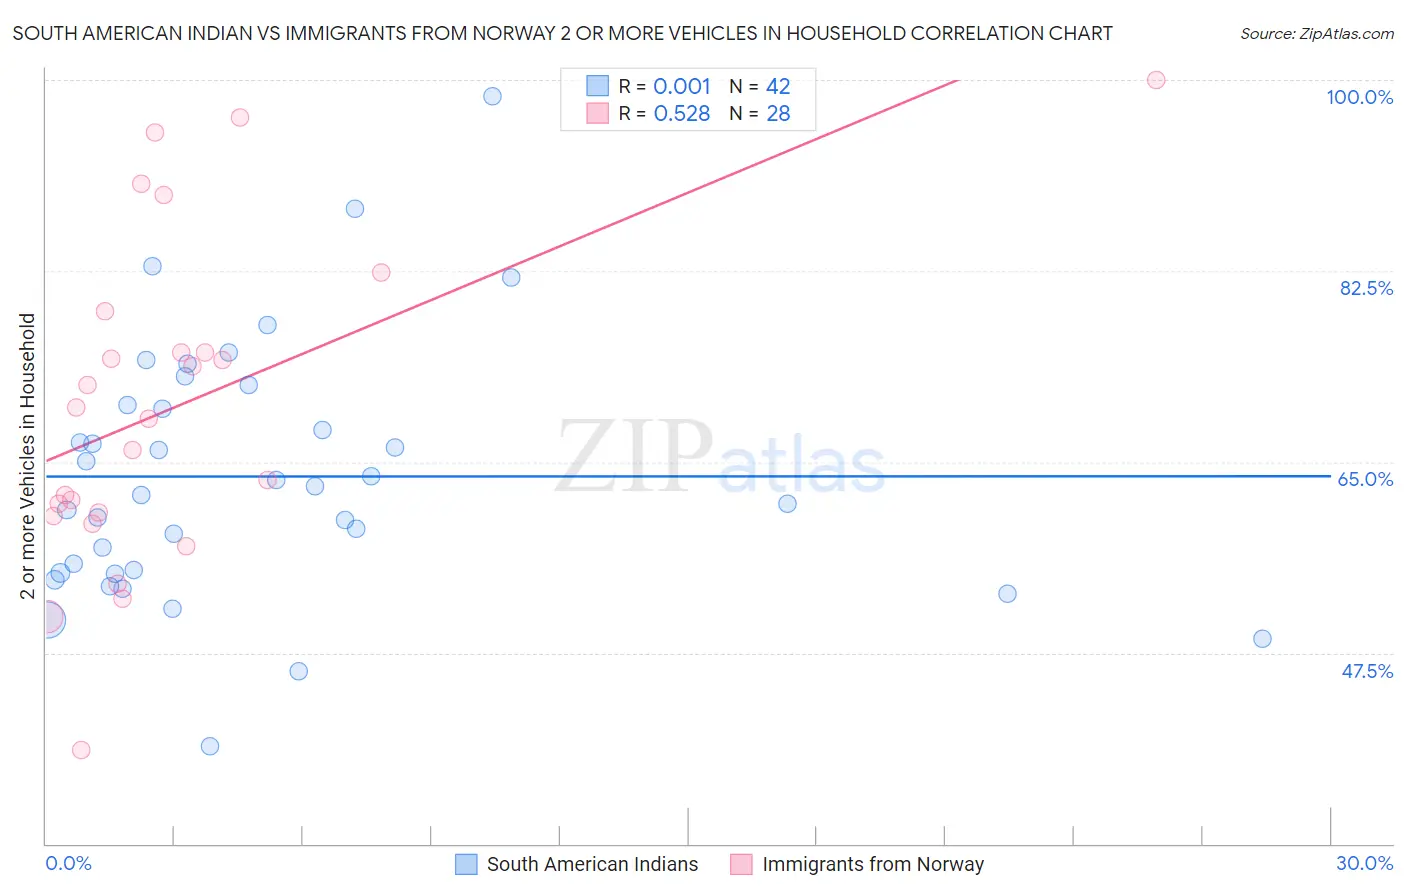
South American Indian vs Immigrants from Norway 2 or more Vehicles in Household Correlation Chart
The statistical analysis conducted on geographies consisting of 164,540,449 people shows no correlation between the proportion of South American Indians and percentage of households with 2 or more vehicles available in the United States with a correlation coefficient (R) of 0.001 and weighted average of 53.9%. Similarly, the statistical analysis conducted on geographies consisting of 116,688,411 people shows a substantial positive correlation between the proportion of Immigrants from Norway and percentage of households with 2 or more vehicles available in the United States with a correlation coefficient (R) of 0.528 and weighted average of 54.4%, a difference of 1.0%.
2 or more Vehicles in Household Correlation Summary
| Measurement | South American Indian | Immigrants from Norway |
| Minimum | 38.9% | 38.6% |
| Maximum | 98.5% | 100.0% |
| Range | 59.6% | 61.4% |
| Mean | 63.7% | 70.1% |
| Median | 62.4% | 69.5% |
| Interquartile 25% (IQ1) | 54.8% | 60.2% |
| Interquartile 75% (IQ3) | 70.2% | 76.9% |
| Interquartile Range (IQR) | 15.4% | 16.7% |
| Standard Deviation (Sample) | 11.8% | 15.0% |
| Standard Deviation (Population) | 11.6% | 14.7% |
Demographics Similar to South American Indians and Immigrants from Norway by 2 or more Vehicles in Household
In terms of 2 or more vehicles in household, the demographic groups most similar to South American Indians are Immigrants from Argentina (53.9%, a difference of 0.060%), Immigrants from Burma/Myanmar (53.9%, a difference of 0.11%), Aleut (54.1%, a difference of 0.40%), Immigrants from Western Asia (54.1%, a difference of 0.40%), and Immigrants from Czechoslovakia (54.1%, a difference of 0.42%). Similarly, the demographic groups most similar to Immigrants from Norway are Houma (54.4%, a difference of 0.0%), Immigrants from Italy (54.4%, a difference of 0.030%), Immigrants from North Macedonia (54.4%, a difference of 0.080%), Immigrants from Peru (54.4%, a difference of 0.12%), and Immigrants from Belgium (54.3%, a difference of 0.17%).
| Demographics | Rating | Rank | 2 or more Vehicles in Household |
| Immigrants | Norway | 15.9 /100 | #199 | Poor 54.4% |
| Houma | 15.8 /100 | #200 | Poor 54.4% |
| Immigrants | Italy | 15.5 /100 | #201 | Poor 54.4% |
| Immigrants | North Macedonia | 14.9 /100 | #202 | Poor 54.4% |
| Immigrants | Peru | 14.3 /100 | #203 | Poor 54.4% |
| Immigrants | Belgium | 13.7 /100 | #204 | Poor 54.3% |
| Cheyenne | 13.6 /100 | #205 | Poor 54.3% |
| Immigrants | Latin America | 13.1 /100 | #206 | Poor 54.3% |
| Turks | 13.0 /100 | #207 | Poor 54.3% |
| Egyptians | 12.0 /100 | #208 | Poor 54.3% |
| Immigrants | Bulgaria | 12.0 /100 | #209 | Poor 54.3% |
| Immigrants | Saudi Arabia | 11.3 /100 | #210 | Poor 54.2% |
| Immigrants | Hungary | 11.3 /100 | #211 | Poor 54.2% |
| Immigrants | Chile | 11.1 /100 | #212 | Poor 54.2% |
| Guatemalans | 9.6 /100 | #213 | Tragic 54.1% |
| Immigrants | Czechoslovakia | 9.4 /100 | #214 | Tragic 54.1% |
| Aleuts | 9.3 /100 | #215 | Tragic 54.1% |
| Immigrants | Western Asia | 9.3 /100 | #216 | Tragic 54.1% |
| Immigrants | Burma/Myanmar | 7.1 /100 | #217 | Tragic 53.9% |
| Immigrants | Argentina | 6.8 /100 | #218 | Tragic 53.9% |
| South American Indians | 6.5 /100 | #219 | Tragic 53.9% |