Somali vs Immigrants from Belgium 3 or more Vehicles in Household
COMPARE
Somali
Immigrants from Belgium
3 or more Vehicles in Household
3 or more Vehicles in Household Comparison
Somalis
Immigrants from Belgium
16.2%
3 OR MORE VEHICLES IN HOUSEHOLD
0.0/ 100
METRIC RATING
306th/ 347
METRIC RANK
18.4%
3 OR MORE VEHICLES IN HOUSEHOLD
4.8/ 100
METRIC RATING
231st/ 347
METRIC RANK
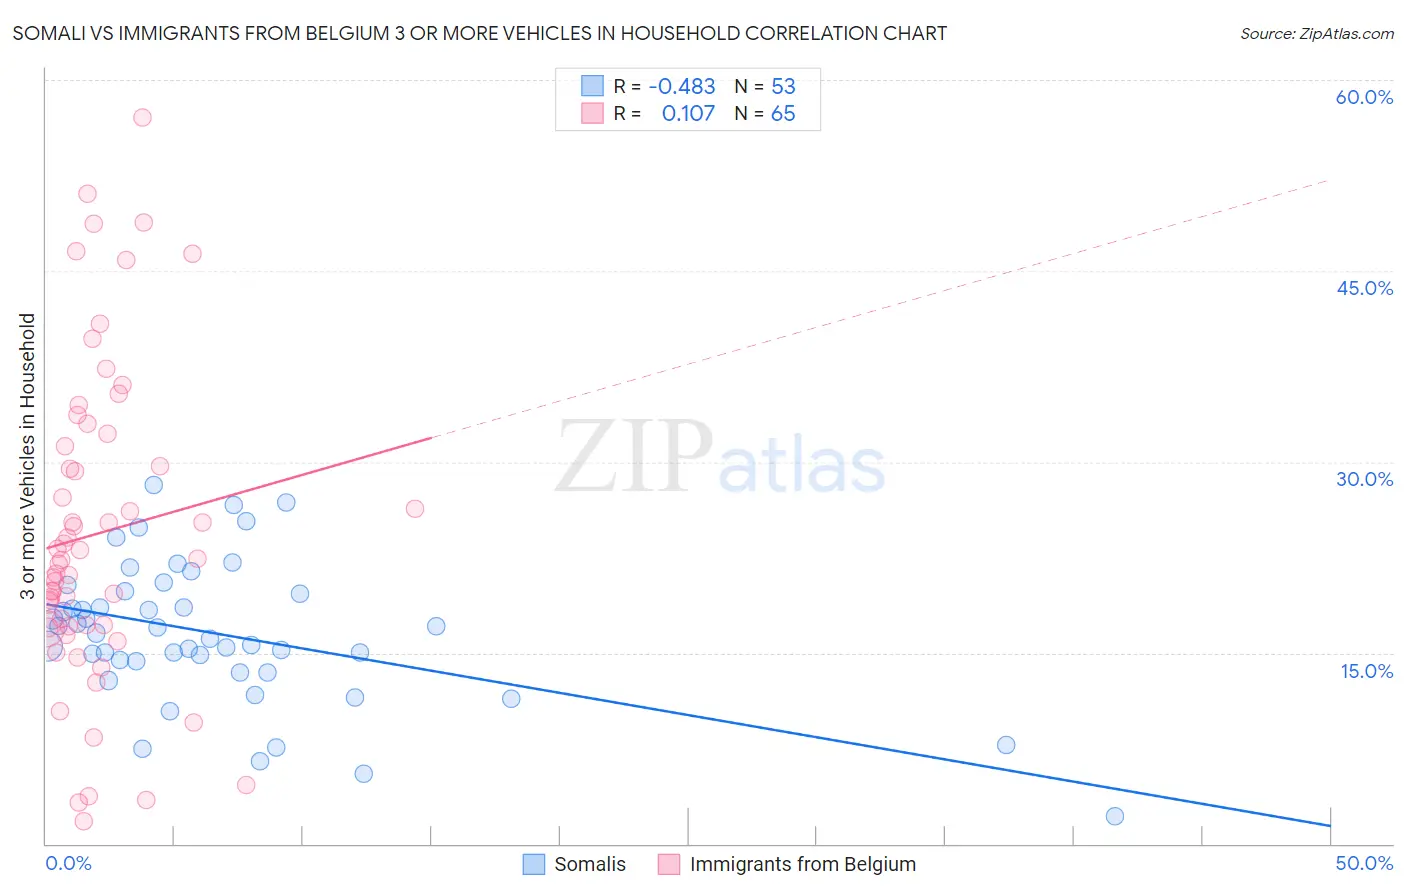
Somali vs Immigrants from Belgium 3 or more Vehicles in Household Correlation Chart
The statistical analysis conducted on geographies consisting of 99,282,686 people shows a moderate negative correlation between the proportion of Somalis and percentage of households with 3 or more vehicles available in the United States with a correlation coefficient (R) of -0.483 and weighted average of 16.2%. Similarly, the statistical analysis conducted on geographies consisting of 146,661,732 people shows a poor positive correlation between the proportion of Immigrants from Belgium and percentage of households with 3 or more vehicles available in the United States with a correlation coefficient (R) of 0.107 and weighted average of 18.4%, a difference of 13.7%.
3 or more Vehicles in Household Correlation Summary
| Measurement | Somali | Immigrants from Belgium |
| Minimum | 2.2% | 1.8% |
| Maximum | 28.2% | 57.0% |
| Range | 26.0% | 55.2% |
| Mean | 16.5% | 24.4% |
| Median | 16.5% | 22.3% |
| Interquartile 25% (IQ1) | 13.9% | 17.0% |
| Interquartile 75% (IQ3) | 19.8% | 31.7% |
| Interquartile Range (IQR) | 5.9% | 14.7% |
| Standard Deviation (Sample) | 5.5% | 12.4% |
| Standard Deviation (Population) | 5.5% | 12.3% |
Similar Demographics by 3 or more Vehicles in Household
Demographics Similar to Somalis by 3 or more Vehicles in Household
In terms of 3 or more vehicles in household, the demographic groups most similar to Somalis are Immigrants from Ghana (16.2%, a difference of 0.15%), Houma (16.1%, a difference of 0.74%), Immigrants from Morocco (16.3%, a difference of 0.82%), Ghanaian (16.4%, a difference of 1.1%), and Immigrants from Serbia (16.4%, a difference of 1.6%).
| Demographics | Rating | Rank | 3 or more Vehicles in Household |
| Immigrants | South America | 0.1 /100 | #299 | Tragic 16.7% |
| Cypriots | 0.0 /100 | #300 | Tragic 16.6% |
| Paraguayans | 0.0 /100 | #301 | Tragic 16.6% |
| Immigrants | Greece | 0.0 /100 | #302 | Tragic 16.5% |
| Immigrants | Serbia | 0.0 /100 | #303 | Tragic 16.4% |
| Ghanaians | 0.0 /100 | #304 | Tragic 16.4% |
| Immigrants | Morocco | 0.0 /100 | #305 | Tragic 16.3% |
| Somalis | 0.0 /100 | #306 | Tragic 16.2% |
| Immigrants | Ghana | 0.0 /100 | #307 | Tragic 16.2% |
| Houma | 0.0 /100 | #308 | Tragic 16.1% |
| Immigrants | Somalia | 0.0 /100 | #309 | Tragic 15.9% |
| Moroccans | 0.0 /100 | #310 | Tragic 15.9% |
| Albanians | 0.0 /100 | #311 | Tragic 15.8% |
| Puerto Ricans | 0.0 /100 | #312 | Tragic 15.6% |
| Immigrants | Israel | 0.0 /100 | #313 | Tragic 15.6% |
Demographics Similar to Immigrants from Belgium by 3 or more Vehicles in Household
In terms of 3 or more vehicles in household, the demographic groups most similar to Immigrants from Belgium are Immigrants from Western Asia (18.4%, a difference of 0.030%), Immigrants from Uganda (18.4%, a difference of 0.060%), Immigrants from Switzerland (18.4%, a difference of 0.080%), Honduran (18.4%, a difference of 0.080%), and Immigrants from North Macedonia (18.4%, a difference of 0.15%).
| Demographics | Rating | Rank | 3 or more Vehicles in Household |
| Immigrants | Argentina | 5.6 /100 | #224 | Tragic 18.5% |
| Immigrants | Lithuania | 5.6 /100 | #225 | Tragic 18.5% |
| Immigrants | Hungary | 5.5 /100 | #226 | Tragic 18.5% |
| Immigrants | Singapore | 5.4 /100 | #227 | Tragic 18.4% |
| Turks | 5.4 /100 | #228 | Tragic 18.4% |
| Immigrants | Switzerland | 5.0 /100 | #229 | Tragic 18.4% |
| Immigrants | Western Asia | 4.8 /100 | #230 | Tragic 18.4% |
| Immigrants | Belgium | 4.8 /100 | #231 | Tragic 18.4% |
| Immigrants | Uganda | 4.6 /100 | #232 | Tragic 18.4% |
| Hondurans | 4.6 /100 | #233 | Tragic 18.4% |
| Immigrants | North Macedonia | 4.4 /100 | #234 | Tragic 18.4% |
| Sierra Leoneans | 3.9 /100 | #235 | Tragic 18.3% |
| Immigrants | Malaysia | 3.6 /100 | #236 | Tragic 18.3% |
| Indonesians | 3.5 /100 | #237 | Tragic 18.3% |
| Immigrants | Honduras | 3.1 /100 | #238 | Tragic 18.2% |