Somali vs Costa Rican 3 or more Vehicles in Household
COMPARE
Somali
Costa Rican
3 or more Vehicles in Household
3 or more Vehicles in Household Comparison
Somalis
Costa Ricans
16.2%
3 OR MORE VEHICLES IN HOUSEHOLD
0.0/ 100
METRIC RATING
306th/ 347
METRIC RANK
20.6%
3 OR MORE VEHICLES IN HOUSEHOLD
94.6/ 100
METRIC RATING
118th/ 347
METRIC RANK
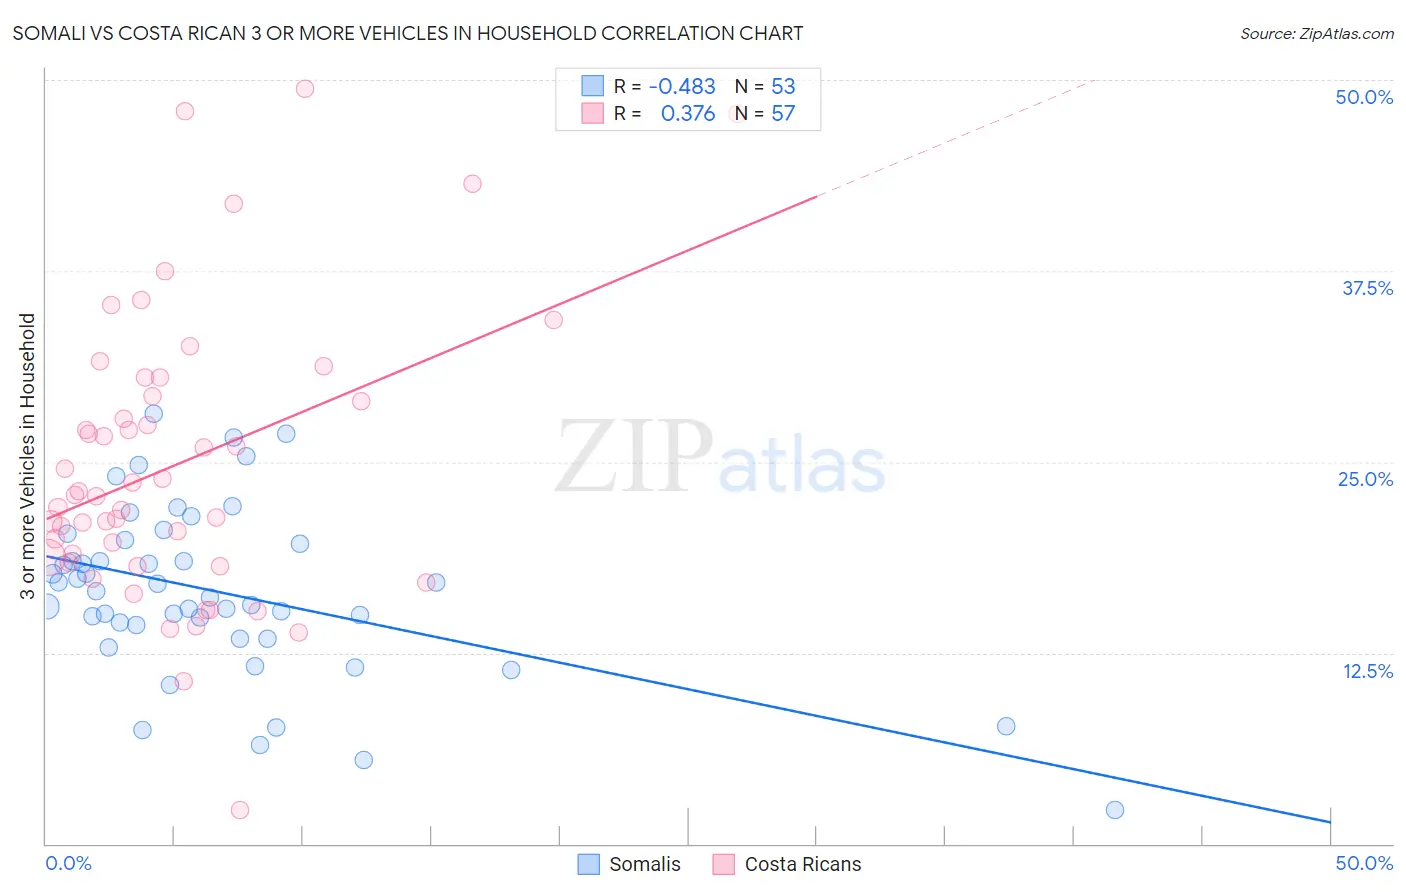
Somali vs Costa Rican 3 or more Vehicles in Household Correlation Chart
The statistical analysis conducted on geographies consisting of 99,282,686 people shows a moderate negative correlation between the proportion of Somalis and percentage of households with 3 or more vehicles available in the United States with a correlation coefficient (R) of -0.483 and weighted average of 16.2%. Similarly, the statistical analysis conducted on geographies consisting of 253,426,253 people shows a mild positive correlation between the proportion of Costa Ricans and percentage of households with 3 or more vehicles available in the United States with a correlation coefficient (R) of 0.376 and weighted average of 20.6%, a difference of 27.0%.
3 or more Vehicles in Household Correlation Summary
| Measurement | Somali | Costa Rican |
| Minimum | 2.2% | 2.2% |
| Maximum | 28.2% | 49.4% |
| Range | 26.0% | 47.2% |
| Mean | 16.5% | 24.9% |
| Median | 16.5% | 22.9% |
| Interquartile 25% (IQ1) | 13.9% | 18.6% |
| Interquartile 75% (IQ3) | 19.8% | 29.9% |
| Interquartile Range (IQR) | 5.9% | 11.3% |
| Standard Deviation (Sample) | 5.5% | 9.4% |
| Standard Deviation (Population) | 5.5% | 9.3% |
Similar Demographics by 3 or more Vehicles in Household
Demographics Similar to Somalis by 3 or more Vehicles in Household
In terms of 3 or more vehicles in household, the demographic groups most similar to Somalis are Immigrants from Ghana (16.2%, a difference of 0.15%), Houma (16.1%, a difference of 0.74%), Immigrants from Morocco (16.3%, a difference of 0.82%), Ghanaian (16.4%, a difference of 1.1%), and Immigrants from Serbia (16.4%, a difference of 1.6%).
| Demographics | Rating | Rank | 3 or more Vehicles in Household |
| Immigrants | South America | 0.1 /100 | #299 | Tragic 16.7% |
| Cypriots | 0.0 /100 | #300 | Tragic 16.6% |
| Paraguayans | 0.0 /100 | #301 | Tragic 16.6% |
| Immigrants | Greece | 0.0 /100 | #302 | Tragic 16.5% |
| Immigrants | Serbia | 0.0 /100 | #303 | Tragic 16.4% |
| Ghanaians | 0.0 /100 | #304 | Tragic 16.4% |
| Immigrants | Morocco | 0.0 /100 | #305 | Tragic 16.3% |
| Somalis | 0.0 /100 | #306 | Tragic 16.2% |
| Immigrants | Ghana | 0.0 /100 | #307 | Tragic 16.2% |
| Houma | 0.0 /100 | #308 | Tragic 16.1% |
| Immigrants | Somalia | 0.0 /100 | #309 | Tragic 15.9% |
| Moroccans | 0.0 /100 | #310 | Tragic 15.9% |
| Albanians | 0.0 /100 | #311 | Tragic 15.8% |
| Puerto Ricans | 0.0 /100 | #312 | Tragic 15.6% |
| Immigrants | Israel | 0.0 /100 | #313 | Tragic 15.6% |
Demographics Similar to Costa Ricans by 3 or more Vehicles in Household
In terms of 3 or more vehicles in household, the demographic groups most similar to Costa Ricans are Immigrants from Latin America (20.5%, a difference of 0.040%), Croatian (20.6%, a difference of 0.11%), Italian (20.6%, a difference of 0.13%), French Canadian (20.6%, a difference of 0.16%), and Maltese (20.5%, a difference of 0.23%).
| Demographics | Rating | Rank | 3 or more Vehicles in Household |
| Immigrants | Micronesia | 96.7 /100 | #111 | Exceptional 20.7% |
| Nicaraguans | 96.2 /100 | #112 | Exceptional 20.7% |
| Immigrants | England | 96.2 /100 | #113 | Exceptional 20.7% |
| Burmese | 95.8 /100 | #114 | Exceptional 20.6% |
| French Canadians | 95.0 /100 | #115 | Exceptional 20.6% |
| Italians | 94.9 /100 | #116 | Exceptional 20.6% |
| Croatians | 94.9 /100 | #117 | Exceptional 20.6% |
| Costa Ricans | 94.6 /100 | #118 | Exceptional 20.6% |
| Immigrants | Latin America | 94.5 /100 | #119 | Exceptional 20.5% |
| Maltese | 93.9 /100 | #120 | Exceptional 20.5% |
| Immigrants | Thailand | 93.8 /100 | #121 | Exceptional 20.5% |
| German Russians | 93.7 /100 | #122 | Exceptional 20.5% |
| Immigrants | Korea | 93.7 /100 | #123 | Exceptional 20.5% |
| Central Americans | 93.1 /100 | #124 | Exceptional 20.5% |
| Immigrants | Netherlands | 92.9 /100 | #125 | Exceptional 20.4% |