Somali vs Immigrants from Laos 3 or more Vehicles in Household
COMPARE
Somali
Immigrants from Laos
3 or more Vehicles in Household
3 or more Vehicles in Household Comparison
Somalis
Immigrants from Laos
16.2%
3 OR MORE VEHICLES IN HOUSEHOLD
0.0/ 100
METRIC RATING
306th/ 347
METRIC RANK
22.4%
3 OR MORE VEHICLES IN HOUSEHOLD
100.0/ 100
METRIC RATING
55th/ 347
METRIC RANK
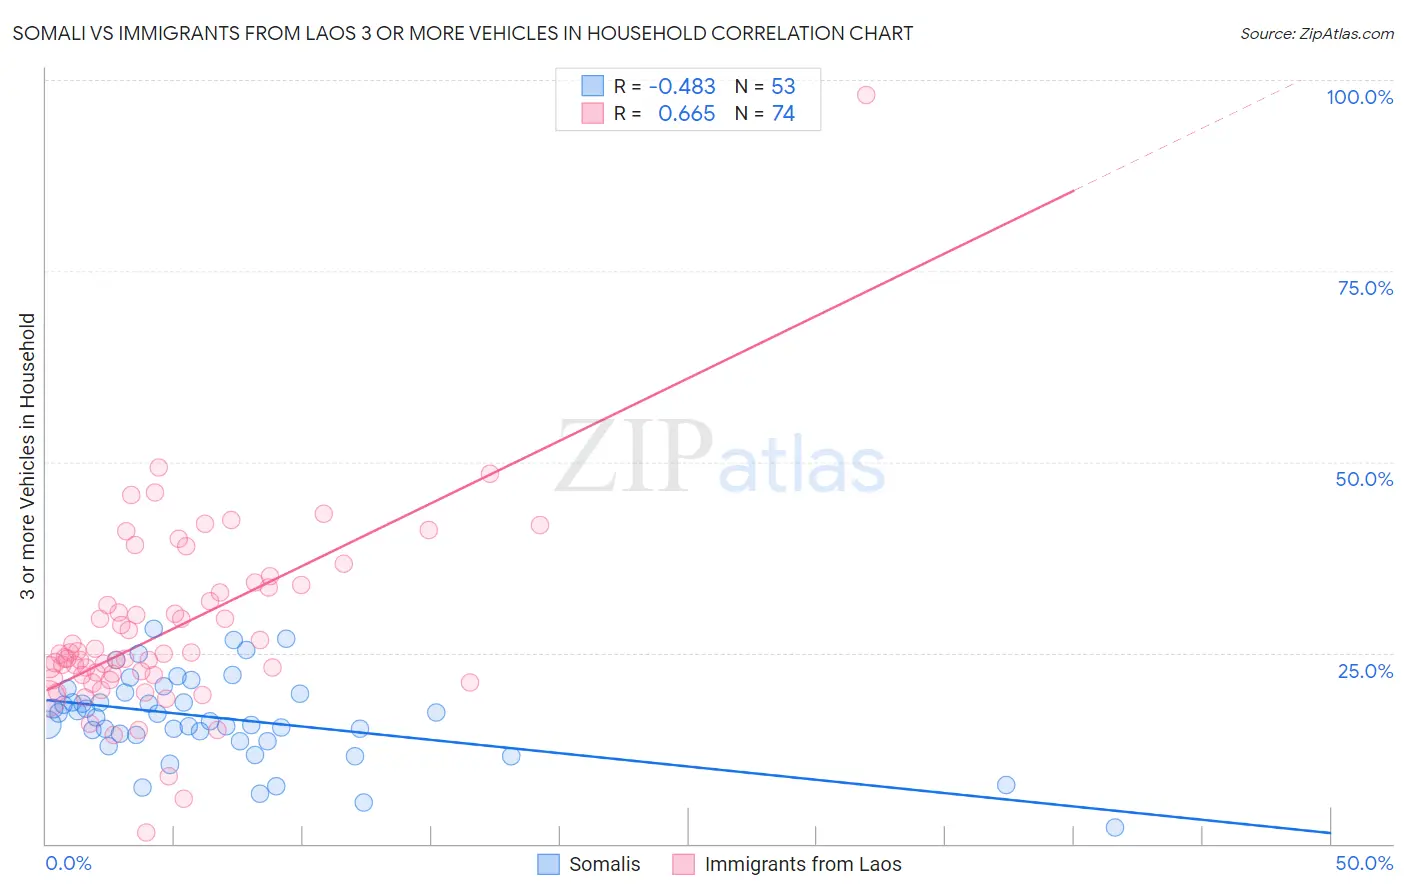
Somali vs Immigrants from Laos 3 or more Vehicles in Household Correlation Chart
The statistical analysis conducted on geographies consisting of 99,282,686 people shows a moderate negative correlation between the proportion of Somalis and percentage of households with 3 or more vehicles available in the United States with a correlation coefficient (R) of -0.483 and weighted average of 16.2%. Similarly, the statistical analysis conducted on geographies consisting of 201,457,324 people shows a significant positive correlation between the proportion of Immigrants from Laos and percentage of households with 3 or more vehicles available in the United States with a correlation coefficient (R) of 0.665 and weighted average of 22.4%, a difference of 38.3%.
3 or more Vehicles in Household Correlation Summary
| Measurement | Somali | Immigrants from Laos |
| Minimum | 2.2% | 1.5% |
| Maximum | 28.2% | 98.0% |
| Range | 26.0% | 96.4% |
| Mean | 16.5% | 28.1% |
| Median | 16.5% | 24.8% |
| Interquartile 25% (IQ1) | 13.9% | 22.0% |
| Interquartile 75% (IQ3) | 19.8% | 33.5% |
| Interquartile Range (IQR) | 5.9% | 11.5% |
| Standard Deviation (Sample) | 5.5% | 12.6% |
| Standard Deviation (Population) | 5.5% | 12.5% |
Similar Demographics by 3 or more Vehicles in Household
Demographics Similar to Somalis by 3 or more Vehicles in Household
In terms of 3 or more vehicles in household, the demographic groups most similar to Somalis are Immigrants from Ghana (16.2%, a difference of 0.15%), Houma (16.1%, a difference of 0.74%), Immigrants from Morocco (16.3%, a difference of 0.82%), Ghanaian (16.4%, a difference of 1.1%), and Immigrants from Serbia (16.4%, a difference of 1.6%).
| Demographics | Rating | Rank | 3 or more Vehicles in Household |
| Immigrants | South America | 0.1 /100 | #299 | Tragic 16.7% |
| Cypriots | 0.0 /100 | #300 | Tragic 16.6% |
| Paraguayans | 0.0 /100 | #301 | Tragic 16.6% |
| Immigrants | Greece | 0.0 /100 | #302 | Tragic 16.5% |
| Immigrants | Serbia | 0.0 /100 | #303 | Tragic 16.4% |
| Ghanaians | 0.0 /100 | #304 | Tragic 16.4% |
| Immigrants | Morocco | 0.0 /100 | #305 | Tragic 16.3% |
| Somalis | 0.0 /100 | #306 | Tragic 16.2% |
| Immigrants | Ghana | 0.0 /100 | #307 | Tragic 16.2% |
| Houma | 0.0 /100 | #308 | Tragic 16.1% |
| Immigrants | Somalia | 0.0 /100 | #309 | Tragic 15.9% |
| Moroccans | 0.0 /100 | #310 | Tragic 15.9% |
| Albanians | 0.0 /100 | #311 | Tragic 15.8% |
| Puerto Ricans | 0.0 /100 | #312 | Tragic 15.6% |
| Immigrants | Israel | 0.0 /100 | #313 | Tragic 15.6% |
Demographics Similar to Immigrants from Laos by 3 or more Vehicles in Household
In terms of 3 or more vehicles in household, the demographic groups most similar to Immigrants from Laos are Hispanic or Latino (22.4%, a difference of 0.030%), Pennsylvania German (22.3%, a difference of 0.18%), Spaniard (22.3%, a difference of 0.32%), Crow (22.5%, a difference of 0.37%), and Navajo (22.3%, a difference of 0.38%).
| Demographics | Rating | Rank | 3 or more Vehicles in Household |
| Scottish | 100.0 /100 | #48 | Exceptional 22.6% |
| Scotch-Irish | 100.0 /100 | #49 | Exceptional 22.6% |
| Sioux | 100.0 /100 | #50 | Exceptional 22.6% |
| Whites/Caucasians | 100.0 /100 | #51 | Exceptional 22.6% |
| Welsh | 100.0 /100 | #52 | Exceptional 22.6% |
| Czechs | 100.0 /100 | #53 | Exceptional 22.5% |
| Crow | 100.0 /100 | #54 | Exceptional 22.5% |
| Immigrants | Laos | 100.0 /100 | #55 | Exceptional 22.4% |
| Hispanics or Latinos | 100.0 /100 | #56 | Exceptional 22.4% |
| Pennsylvania Germans | 100.0 /100 | #57 | Exceptional 22.3% |
| Spaniards | 100.0 /100 | #58 | Exceptional 22.3% |
| Navajo | 100.0 /100 | #59 | Exceptional 22.3% |
| Finns | 99.9 /100 | #60 | Exceptional 22.3% |
| Bhutanese | 99.9 /100 | #61 | Exceptional 22.2% |
| Fijians | 99.9 /100 | #62 | Exceptional 22.2% |