Immigrants from India vs Costa Rican 3 or more Vehicles in Household
COMPARE
Immigrants from India
Costa Rican
3 or more Vehicles in Household
3 or more Vehicles in Household Comparison
Immigrants from India
Costa Ricans
20.2%
3 OR MORE VEHICLES IN HOUSEHOLD
87.2/ 100
METRIC RATING
135th/ 347
METRIC RANK
20.6%
3 OR MORE VEHICLES IN HOUSEHOLD
94.6/ 100
METRIC RATING
118th/ 347
METRIC RANK
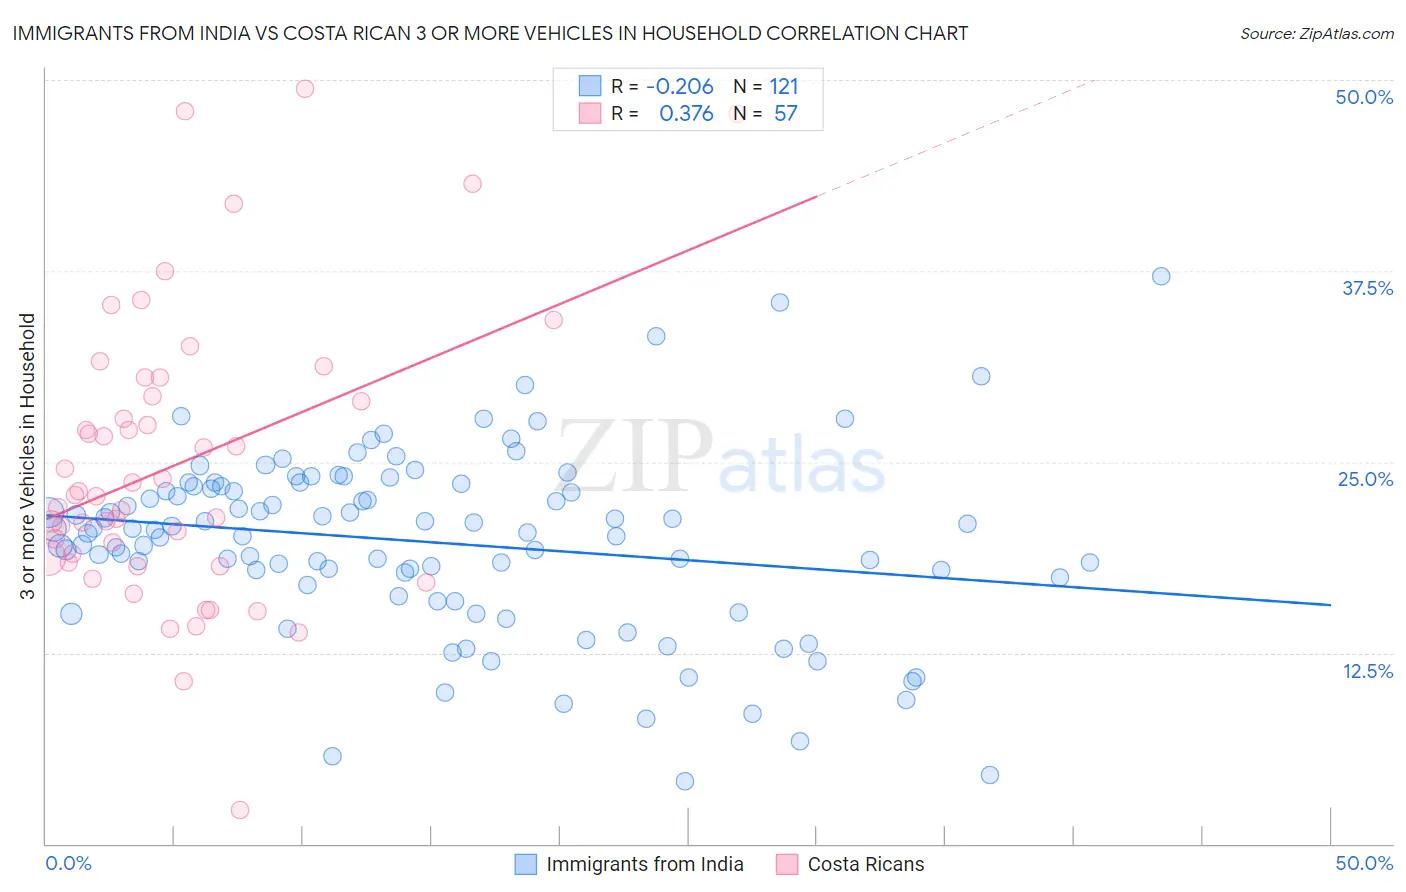
Immigrants from India vs Costa Rican 3 or more Vehicles in Household Correlation Chart
The statistical analysis conducted on geographies consisting of 433,547,679 people shows a weak negative correlation between the proportion of Immigrants from India and percentage of households with 3 or more vehicles available in the United States with a correlation coefficient (R) of -0.206 and weighted average of 20.2%. Similarly, the statistical analysis conducted on geographies consisting of 253,426,253 people shows a mild positive correlation between the proportion of Costa Ricans and percentage of households with 3 or more vehicles available in the United States with a correlation coefficient (R) of 0.376 and weighted average of 20.6%, a difference of 1.7%.
3 or more Vehicles in Household Correlation Summary
| Measurement | Immigrants from India | Costa Rican |
| Minimum | 4.1% | 2.2% |
| Maximum | 37.1% | 49.4% |
| Range | 33.0% | 47.2% |
| Mean | 19.8% | 24.9% |
| Median | 20.5% | 22.9% |
| Interquartile 25% (IQ1) | 17.2% | 18.6% |
| Interquartile 75% (IQ3) | 23.4% | 29.9% |
| Interquartile Range (IQR) | 6.2% | 11.3% |
| Standard Deviation (Sample) | 5.9% | 9.4% |
| Standard Deviation (Population) | 5.9% | 9.3% |
Demographics Similar to Immigrants from India and Costa Ricans by 3 or more Vehicles in Household
In terms of 3 or more vehicles in household, the demographic groups most similar to Immigrants from India are Immigrants from Nicaragua (20.2%, a difference of 0.010%), Polish (20.2%, a difference of 0.020%), Immigrants from Canada (20.2%, a difference of 0.11%), Immigrants from North America (20.2%, a difference of 0.11%), and Immigrants from Asia (20.2%, a difference of 0.17%). Similarly, the demographic groups most similar to Costa Ricans are Immigrants from Latin America (20.5%, a difference of 0.040%), Croatian (20.6%, a difference of 0.11%), Italian (20.6%, a difference of 0.13%), Maltese (20.5%, a difference of 0.23%), and Immigrants from Thailand (20.5%, a difference of 0.25%).
| Demographics | Rating | Rank | 3 or more Vehicles in Household |
| Italians | 94.9 /100 | #116 | Exceptional 20.6% |
| Croatians | 94.9 /100 | #117 | Exceptional 20.6% |
| Costa Ricans | 94.6 /100 | #118 | Exceptional 20.6% |
| Immigrants | Latin America | 94.5 /100 | #119 | Exceptional 20.5% |
| Maltese | 93.9 /100 | #120 | Exceptional 20.5% |
| Immigrants | Thailand | 93.8 /100 | #121 | Exceptional 20.5% |
| German Russians | 93.7 /100 | #122 | Exceptional 20.5% |
| Immigrants | Korea | 93.7 /100 | #123 | Exceptional 20.5% |
| Central Americans | 93.1 /100 | #124 | Exceptional 20.5% |
| Immigrants | Netherlands | 92.9 /100 | #125 | Exceptional 20.4% |
| Slavs | 92.1 /100 | #126 | Exceptional 20.4% |
| Immigrants | Bolivia | 92.0 /100 | #127 | Exceptional 20.4% |
| New Zealanders | 91.3 /100 | #128 | Exceptional 20.4% |
| Zimbabweans | 88.7 /100 | #129 | Excellent 20.3% |
| Greeks | 88.6 /100 | #130 | Excellent 20.3% |
| Immigrants | Asia | 88.1 /100 | #131 | Excellent 20.2% |
| Immigrants | Canada | 87.8 /100 | #132 | Excellent 20.2% |
| Immigrants | North America | 87.8 /100 | #133 | Excellent 20.2% |
| Poles | 87.3 /100 | #134 | Excellent 20.2% |
| Immigrants | India | 87.2 /100 | #135 | Excellent 20.2% |
| Immigrants | Nicaragua | 87.1 /100 | #136 | Excellent 20.2% |