Slavic vs Guamanian/Chamorro 4 or more Vehicles in Household
COMPARE
Slavic
Guamanian/Chamorro
4 or more Vehicles in Household
4 or more Vehicles in Household Comparison
Slavs
Guamanians/Chamorros
6.6%
4 OR MORE VEHICLES IN HOUSEHOLD
81.6/ 100
METRIC RATING
140th/ 347
METRIC RANK
8.1%
4 OR MORE VEHICLES IN HOUSEHOLD
100.0/ 100
METRIC RATING
35th/ 347
METRIC RANK
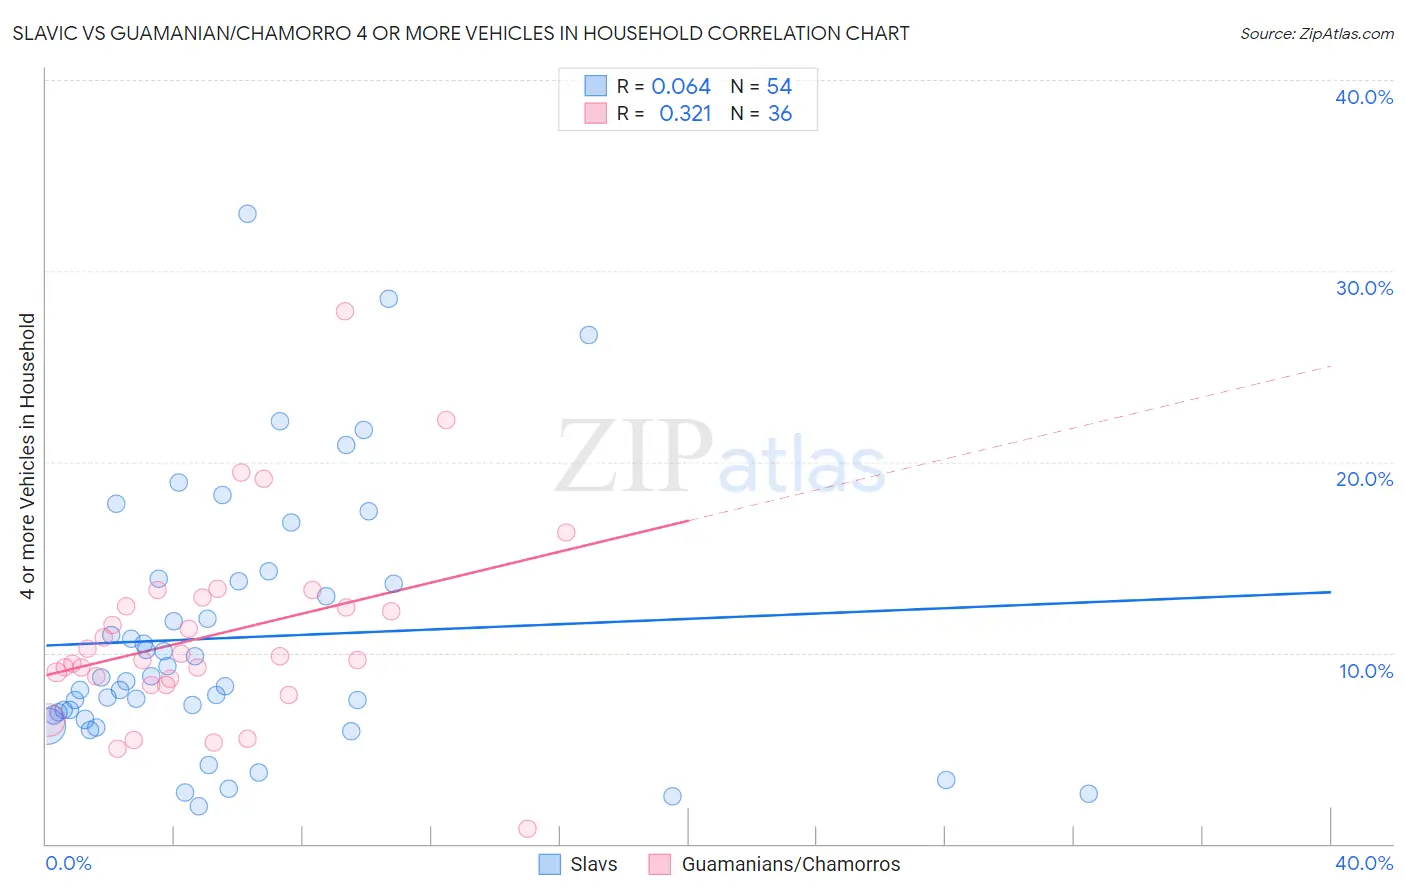
Slavic vs Guamanian/Chamorro 4 or more Vehicles in Household Correlation Chart
The statistical analysis conducted on geographies consisting of 270,086,100 people shows a slight positive correlation between the proportion of Slavs and percentage of households with 4 or more vehicles available in the United States with a correlation coefficient (R) of 0.064 and weighted average of 6.6%. Similarly, the statistical analysis conducted on geographies consisting of 221,490,989 people shows a mild positive correlation between the proportion of Guamanians/Chamorros and percentage of households with 4 or more vehicles available in the United States with a correlation coefficient (R) of 0.321 and weighted average of 8.1%, a difference of 22.8%.
4 or more Vehicles in Household Correlation Summary
| Measurement | Slavic | Guamanian/Chamorro |
| Minimum | 2.0% | 0.81% |
| Maximum | 33.0% | 27.9% |
| Range | 31.0% | 27.1% |
| Mean | 10.8% | 10.9% |
| Median | 8.6% | 9.7% |
| Interquartile 25% (IQ1) | 6.7% | 8.5% |
| Interquartile 75% (IQ3) | 13.7% | 12.7% |
| Interquartile Range (IQR) | 7.0% | 4.2% |
| Standard Deviation (Sample) | 6.8% | 5.1% |
| Standard Deviation (Population) | 6.8% | 5.0% |
Similar Demographics by 4 or more Vehicles in Household
Demographics Similar to Slavs by 4 or more Vehicles in Household
In terms of 4 or more vehicles in household, the demographic groups most similar to Slavs are Jordanian (6.6%, a difference of 0.080%), Australian (6.6%, a difference of 0.13%), Immigrants from Iraq (6.5%, a difference of 0.33%), Immigrants from Canada (6.5%, a difference of 0.46%), and Immigrants from North America (6.5%, a difference of 0.48%).
| Demographics | Rating | Rank | 4 or more Vehicles in Household |
| Armenians | 86.9 /100 | #133 | Excellent 6.6% |
| Ottawa | 86.9 /100 | #134 | Excellent 6.6% |
| Tohono O'odham | 86.7 /100 | #135 | Excellent 6.6% |
| Luxembourgers | 86.4 /100 | #136 | Excellent 6.6% |
| French Canadians | 85.4 /100 | #137 | Excellent 6.6% |
| Italians | 84.5 /100 | #138 | Excellent 6.6% |
| Jordanians | 82.1 /100 | #139 | Excellent 6.6% |
| Slavs | 81.6 /100 | #140 | Excellent 6.6% |
| Australians | 80.8 /100 | #141 | Excellent 6.6% |
| Immigrants | Iraq | 79.4 /100 | #142 | Good 6.5% |
| Immigrants | Canada | 78.6 /100 | #143 | Good 6.5% |
| Immigrants | North America | 78.5 /100 | #144 | Good 6.5% |
| Croatians | 77.8 /100 | #145 | Good 6.5% |
| Immigrants | Costa Rica | 74.4 /100 | #146 | Good 6.5% |
| Immigrants | Iran | 73.9 /100 | #147 | Good 6.5% |
Demographics Similar to Guamanians/Chamorros by 4 or more Vehicles in Household
In terms of 4 or more vehicles in household, the demographic groups most similar to Guamanians/Chamorros are Alaskan Athabascan (8.1%, a difference of 0.20%), Norwegian (8.0%, a difference of 0.79%), Yaqui (8.1%, a difference of 0.80%), Scandinavian (8.0%, a difference of 0.96%), and Sioux (8.0%, a difference of 0.99%).
| Demographics | Rating | Rank | 4 or more Vehicles in Household |
| Cheyenne | 100.0 /100 | #28 | Exceptional 8.3% |
| Immigrants | South Eastern Asia | 100.0 /100 | #29 | Exceptional 8.2% |
| Navajo | 100.0 /100 | #30 | Exceptional 8.2% |
| Natives/Alaskans | 100.0 /100 | #31 | Exceptional 8.2% |
| Marshallese | 100.0 /100 | #32 | Exceptional 8.1% |
| Yaqui | 100.0 /100 | #33 | Exceptional 8.1% |
| Alaskan Athabascans | 100.0 /100 | #34 | Exceptional 8.1% |
| Guamanians/Chamorros | 100.0 /100 | #35 | Exceptional 8.1% |
| Norwegians | 100.0 /100 | #36 | Exceptional 8.0% |
| Scandinavians | 100.0 /100 | #37 | Exceptional 8.0% |
| Sioux | 100.0 /100 | #38 | Exceptional 8.0% |
| Spanish Americans | 100.0 /100 | #39 | Exceptional 8.0% |
| Spanish | 100.0 /100 | #40 | Exceptional 7.9% |
| Pima | 100.0 /100 | #41 | Exceptional 7.9% |
| Salvadorans | 100.0 /100 | #42 | Exceptional 7.8% |