Slavic vs Guamanian/Chamorro Disability Age 35 to 64
COMPARE
Slavic
Guamanian/Chamorro
Disability Age 35 to 64
Disability Age 35 to 64 Comparison
Slavs
Guamanians/Chamorros
11.7%
DISABILITY AGE 35 TO 64
15.5/ 100
METRIC RATING
205th/ 347
METRIC RANK
12.2%
DISABILITY AGE 35 TO 64
1.4/ 100
METRIC RATING
246th/ 347
METRIC RANK
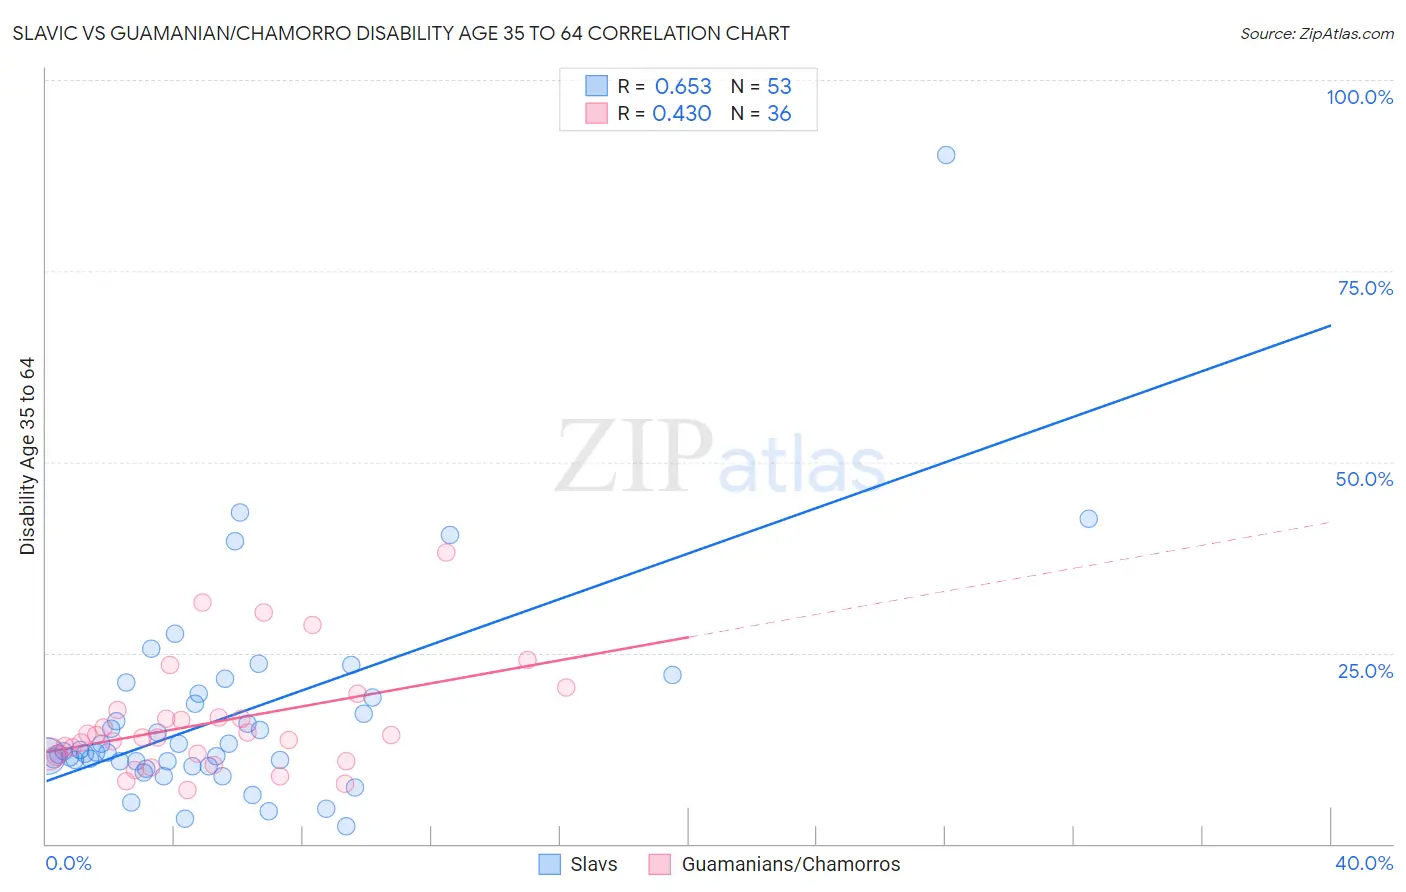
Slavic vs Guamanian/Chamorro Disability Age 35 to 64 Correlation Chart
The statistical analysis conducted on geographies consisting of 270,786,875 people shows a significant positive correlation between the proportion of Slavs and percentage of population with a disability between the ages 34 and 64 in the United States with a correlation coefficient (R) of 0.653 and weighted average of 11.7%. Similarly, the statistical analysis conducted on geographies consisting of 221,858,951 people shows a moderate positive correlation between the proportion of Guamanians/Chamorros and percentage of population with a disability between the ages 34 and 64 in the United States with a correlation coefficient (R) of 0.430 and weighted average of 12.2%, a difference of 5.0%.
Disability Age 35 to 64 Correlation Summary
| Measurement | Slavic | Guamanian/Chamorro |
| Minimum | 2.3% | 7.0% |
| Maximum | 90.1% | 38.2% |
| Range | 87.9% | 31.2% |
| Mean | 16.7% | 15.9% |
| Median | 12.0% | 14.1% |
| Interquartile 25% (IQ1) | 10.5% | 11.7% |
| Interquartile 75% (IQ3) | 19.5% | 17.0% |
| Interquartile Range (IQR) | 9.0% | 5.3% |
| Standard Deviation (Sample) | 13.9% | 7.1% |
| Standard Deviation (Population) | 13.8% | 7.0% |
Similar Demographics by Disability Age 35 to 64
Demographics Similar to Slavs by Disability Age 35 to 64
In terms of disability age 35 to 64, the demographic groups most similar to Slavs are Native Hawaiian (11.7%, a difference of 0.10%), Ghanaian (11.7%, a difference of 0.10%), Nigerian (11.6%, a difference of 0.11%), Guatemalan (11.7%, a difference of 0.13%), and British (11.6%, a difference of 0.22%).
| Demographics | Rating | Rank | Disability Age 35 to 64 |
| Immigrants | Panama | 20.4 /100 | #198 | Fair 11.6% |
| Basques | 19.5 /100 | #199 | Poor 11.6% |
| Swiss | 18.7 /100 | #200 | Poor 11.6% |
| Immigrants | Kenya | 17.7 /100 | #201 | Poor 11.6% |
| Immigrants | Guatemala | 17.5 /100 | #202 | Poor 11.6% |
| British | 17.0 /100 | #203 | Poor 11.6% |
| Nigerians | 16.3 /100 | #204 | Poor 11.6% |
| Slavs | 15.5 /100 | #205 | Poor 11.7% |
| Native Hawaiians | 14.8 /100 | #206 | Poor 11.7% |
| Ghanaians | 14.8 /100 | #207 | Poor 11.7% |
| Guatemalans | 14.6 /100 | #208 | Poor 11.7% |
| Europeans | 13.5 /100 | #209 | Poor 11.7% |
| Belgians | 13.1 /100 | #210 | Poor 11.7% |
| Canadians | 13.0 /100 | #211 | Poor 11.7% |
| Immigrants | Jamaica | 11.8 /100 | #212 | Poor 11.7% |
Demographics Similar to Guamanians/Chamorros by Disability Age 35 to 64
In terms of disability age 35 to 64, the demographic groups most similar to Guamanians/Chamorros are Immigrants from Senegal (12.2%, a difference of 0.040%), Spaniard (12.3%, a difference of 0.13%), Hispanic or Latino (12.3%, a difference of 0.16%), Immigrants from Burma/Myanmar (12.3%, a difference of 0.29%), and German (12.3%, a difference of 0.37%).
| Demographics | Rating | Rank | Disability Age 35 to 64 |
| Immigrants | Western Africa | 3.3 /100 | #239 | Tragic 12.0% |
| Immigrants | Thailand | 3.3 /100 | #240 | Tragic 12.0% |
| Mexican American Indians | 3.2 /100 | #241 | Tragic 12.0% |
| Samoans | 2.8 /100 | #242 | Tragic 12.1% |
| Slovaks | 2.7 /100 | #243 | Tragic 12.1% |
| Finns | 2.3 /100 | #244 | Tragic 12.1% |
| Immigrants | Mexico | 2.2 /100 | #245 | Tragic 12.1% |
| Guamanians/Chamorros | 1.4 /100 | #246 | Tragic 12.2% |
| Immigrants | Senegal | 1.3 /100 | #247 | Tragic 12.2% |
| Spaniards | 1.3 /100 | #248 | Tragic 12.3% |
| Hispanics or Latinos | 1.3 /100 | #249 | Tragic 12.3% |
| Immigrants | Burma/Myanmar | 1.2 /100 | #250 | Tragic 12.3% |
| Germans | 1.1 /100 | #251 | Tragic 12.3% |
| Irish | 1.0 /100 | #252 | Tragic 12.3% |
| Dutch | 1.0 /100 | #253 | Tragic 12.3% |