Immigrants from Kuwait vs Guamanian/Chamorro 4 or more Vehicles in Household
COMPARE
Immigrants from Kuwait
Guamanian/Chamorro
4 or more Vehicles in Household
4 or more Vehicles in Household Comparison
Immigrants from Kuwait
Guamanians/Chamorros
6.2%
4 OR MORE VEHICLES IN HOUSEHOLD
28.0/ 100
METRIC RATING
193rd/ 347
METRIC RANK
8.1%
4 OR MORE VEHICLES IN HOUSEHOLD
100.0/ 100
METRIC RATING
35th/ 347
METRIC RANK
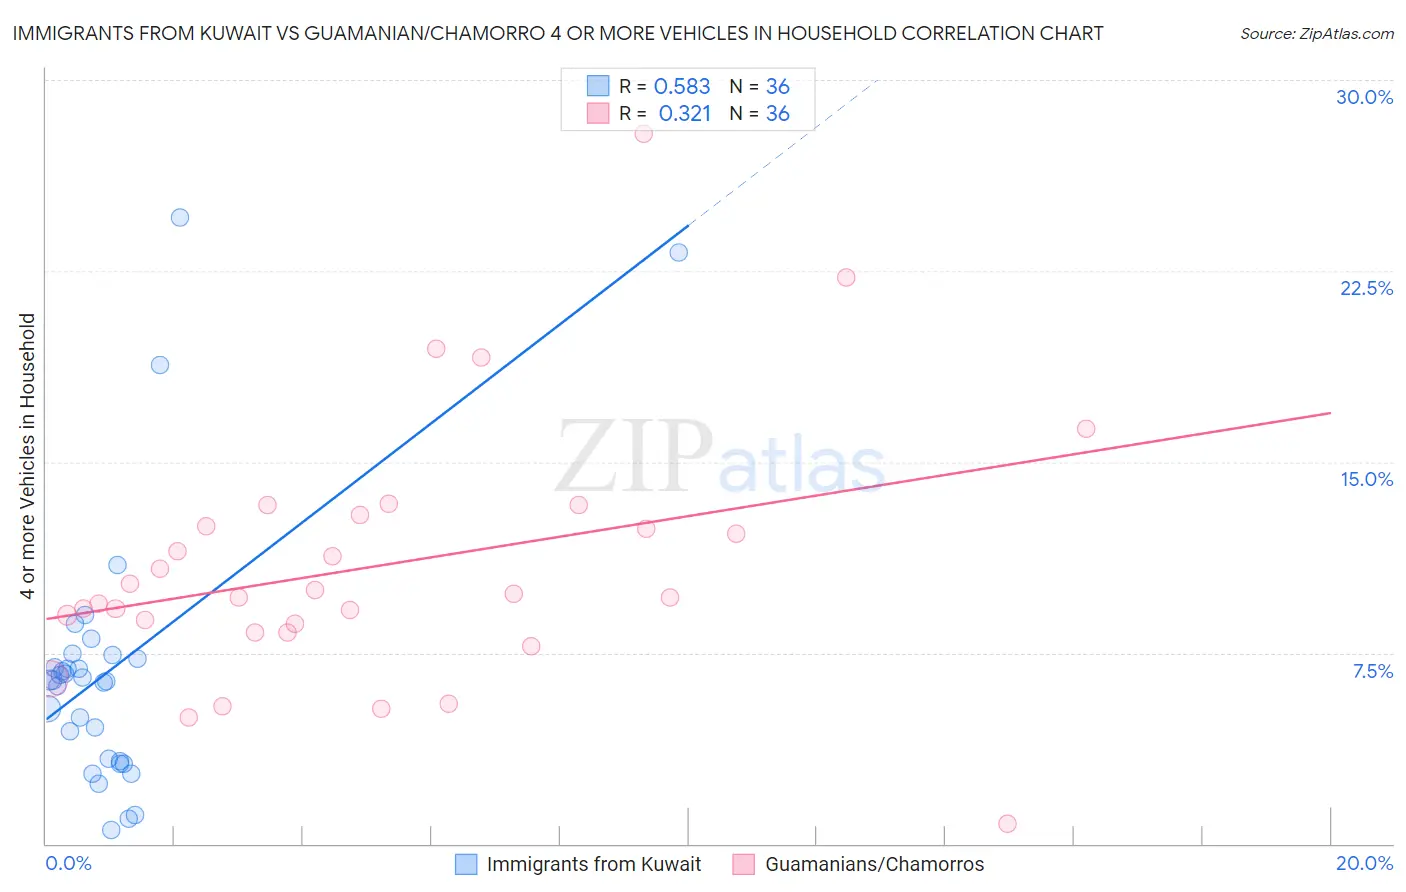
Immigrants from Kuwait vs Guamanian/Chamorro 4 or more Vehicles in Household Correlation Chart
The statistical analysis conducted on geographies consisting of 136,548,104 people shows a substantial positive correlation between the proportion of Immigrants from Kuwait and percentage of households with 4 or more vehicles available in the United States with a correlation coefficient (R) of 0.583 and weighted average of 6.2%. Similarly, the statistical analysis conducted on geographies consisting of 221,490,989 people shows a mild positive correlation between the proportion of Guamanians/Chamorros and percentage of households with 4 or more vehicles available in the United States with a correlation coefficient (R) of 0.321 and weighted average of 8.1%, a difference of 30.5%.
4 or more Vehicles in Household Correlation Summary
| Measurement | Immigrants from Kuwait | Guamanian/Chamorro |
| Minimum | 0.56% | 0.81% |
| Maximum | 24.6% | 27.9% |
| Range | 24.1% | 27.1% |
| Mean | 6.9% | 10.9% |
| Median | 6.4% | 9.7% |
| Interquartile 25% (IQ1) | 3.3% | 8.5% |
| Interquartile 75% (IQ3) | 7.3% | 12.7% |
| Interquartile Range (IQR) | 4.1% | 4.2% |
| Standard Deviation (Sample) | 5.3% | 5.1% |
| Standard Deviation (Population) | 5.2% | 5.0% |
Similar Demographics by 4 or more Vehicles in Household
Demographics Similar to Immigrants from Kuwait by 4 or more Vehicles in Household
In terms of 4 or more vehicles in household, the demographic groups most similar to Immigrants from Kuwait are Immigrants from Sweden (6.2%, a difference of 0.13%), Argentinean (6.2%, a difference of 0.13%), Tsimshian (6.2%, a difference of 0.20%), Romanian (6.2%, a difference of 0.34%), and Inupiat (6.2%, a difference of 0.35%).
| Demographics | Rating | Rank | 4 or more Vehicles in Household |
| Immigrants | Northern Europe | 36.8 /100 | #186 | Fair 6.2% |
| Immigrants | South Africa | 35.4 /100 | #187 | Fair 6.2% |
| Kiowa | 34.7 /100 | #188 | Fair 6.2% |
| Immigrants | Eastern Asia | 33.3 /100 | #189 | Fair 6.2% |
| South Africans | 32.2 /100 | #190 | Fair 6.2% |
| Inupiat | 30.7 /100 | #191 | Fair 6.2% |
| Romanians | 30.7 /100 | #192 | Fair 6.2% |
| Immigrants | Kuwait | 28.0 /100 | #193 | Fair 6.2% |
| Immigrants | Sweden | 27.0 /100 | #194 | Fair 6.2% |
| Argentineans | 27.0 /100 | #195 | Fair 6.2% |
| Tsimshian | 26.4 /100 | #196 | Fair 6.2% |
| Immigrants | Sri Lanka | 23.7 /100 | #197 | Fair 6.1% |
| Immigrants | Portugal | 22.3 /100 | #198 | Fair 6.1% |
| Immigrants | Norway | 21.8 /100 | #199 | Fair 6.1% |
| Latvians | 21.7 /100 | #200 | Fair 6.1% |
Demographics Similar to Guamanians/Chamorros by 4 or more Vehicles in Household
In terms of 4 or more vehicles in household, the demographic groups most similar to Guamanians/Chamorros are Alaskan Athabascan (8.1%, a difference of 0.20%), Norwegian (8.0%, a difference of 0.79%), Yaqui (8.1%, a difference of 0.80%), Scandinavian (8.0%, a difference of 0.96%), and Sioux (8.0%, a difference of 0.99%).
| Demographics | Rating | Rank | 4 or more Vehicles in Household |
| Cheyenne | 100.0 /100 | #28 | Exceptional 8.3% |
| Immigrants | South Eastern Asia | 100.0 /100 | #29 | Exceptional 8.2% |
| Navajo | 100.0 /100 | #30 | Exceptional 8.2% |
| Natives/Alaskans | 100.0 /100 | #31 | Exceptional 8.2% |
| Marshallese | 100.0 /100 | #32 | Exceptional 8.1% |
| Yaqui | 100.0 /100 | #33 | Exceptional 8.1% |
| Alaskan Athabascans | 100.0 /100 | #34 | Exceptional 8.1% |
| Guamanians/Chamorros | 100.0 /100 | #35 | Exceptional 8.1% |
| Norwegians | 100.0 /100 | #36 | Exceptional 8.0% |
| Scandinavians | 100.0 /100 | #37 | Exceptional 8.0% |
| Sioux | 100.0 /100 | #38 | Exceptional 8.0% |
| Spanish Americans | 100.0 /100 | #39 | Exceptional 8.0% |
| Spanish | 100.0 /100 | #40 | Exceptional 7.9% |
| Pima | 100.0 /100 | #41 | Exceptional 7.9% |
| Salvadorans | 100.0 /100 | #42 | Exceptional 7.8% |