Slavic vs Bhutanese 4 or more Vehicles in Household
COMPARE
Slavic
Bhutanese
4 or more Vehicles in Household
4 or more Vehicles in Household Comparison
Slavs
Bhutanese
6.6%
4 OR MORE VEHICLES IN HOUSEHOLD
81.6/ 100
METRIC RATING
140th/ 347
METRIC RANK
7.8%
4 OR MORE VEHICLES IN HOUSEHOLD
100.0/ 100
METRIC RATING
44th/ 347
METRIC RANK
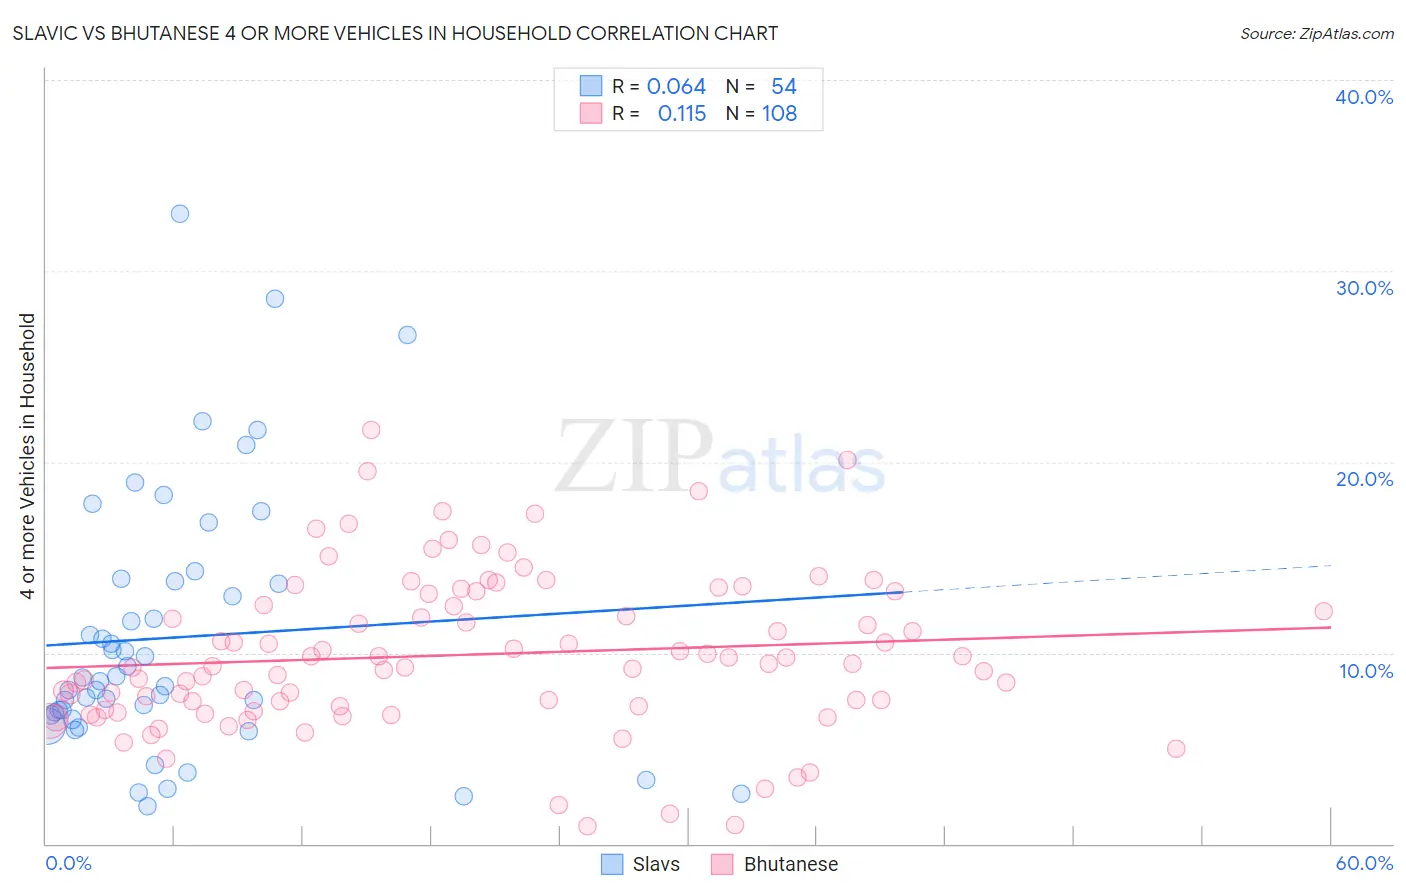
Slavic vs Bhutanese 4 or more Vehicles in Household Correlation Chart
The statistical analysis conducted on geographies consisting of 270,086,100 people shows a slight positive correlation between the proportion of Slavs and percentage of households with 4 or more vehicles available in the United States with a correlation coefficient (R) of 0.064 and weighted average of 6.6%. Similarly, the statistical analysis conducted on geographies consisting of 453,167,793 people shows a poor positive correlation between the proportion of Bhutanese and percentage of households with 4 or more vehicles available in the United States with a correlation coefficient (R) of 0.115 and weighted average of 7.8%, a difference of 18.8%.
4 or more Vehicles in Household Correlation Summary
| Measurement | Slavic | Bhutanese |
| Minimum | 2.0% | 0.93% |
| Maximum | 33.0% | 21.7% |
| Range | 31.0% | 20.7% |
| Mean | 10.8% | 9.9% |
| Median | 8.6% | 9.3% |
| Interquartile 25% (IQ1) | 6.7% | 7.1% |
| Interquartile 75% (IQ3) | 13.7% | 12.8% |
| Interquartile Range (IQR) | 7.0% | 5.7% |
| Standard Deviation (Sample) | 6.8% | 4.1% |
| Standard Deviation (Population) | 6.8% | 4.1% |
Similar Demographics by 4 or more Vehicles in Household
Demographics Similar to Slavs by 4 or more Vehicles in Household
In terms of 4 or more vehicles in household, the demographic groups most similar to Slavs are Jordanian (6.6%, a difference of 0.080%), Australian (6.6%, a difference of 0.13%), Immigrants from Iraq (6.5%, a difference of 0.33%), Immigrants from Canada (6.5%, a difference of 0.46%), and Immigrants from North America (6.5%, a difference of 0.48%).
| Demographics | Rating | Rank | 4 or more Vehicles in Household |
| Armenians | 86.9 /100 | #133 | Excellent 6.6% |
| Ottawa | 86.9 /100 | #134 | Excellent 6.6% |
| Tohono O'odham | 86.7 /100 | #135 | Excellent 6.6% |
| Luxembourgers | 86.4 /100 | #136 | Excellent 6.6% |
| French Canadians | 85.4 /100 | #137 | Excellent 6.6% |
| Italians | 84.5 /100 | #138 | Excellent 6.6% |
| Jordanians | 82.1 /100 | #139 | Excellent 6.6% |
| Slavs | 81.6 /100 | #140 | Excellent 6.6% |
| Australians | 80.8 /100 | #141 | Excellent 6.6% |
| Immigrants | Iraq | 79.4 /100 | #142 | Good 6.5% |
| Immigrants | Canada | 78.6 /100 | #143 | Good 6.5% |
| Immigrants | North America | 78.5 /100 | #144 | Good 6.5% |
| Croatians | 77.8 /100 | #145 | Good 6.5% |
| Immigrants | Costa Rica | 74.4 /100 | #146 | Good 6.5% |
| Immigrants | Iran | 73.9 /100 | #147 | Good 6.5% |
Demographics Similar to Bhutanese by 4 or more Vehicles in Household
In terms of 4 or more vehicles in household, the demographic groups most similar to Bhutanese are Choctaw (7.8%, a difference of 0.050%), Crow (7.8%, a difference of 0.22%), Fijian (7.8%, a difference of 0.26%), Salvadoran (7.8%, a difference of 0.38%), and Osage (7.8%, a difference of 0.38%).
| Demographics | Rating | Rank | 4 or more Vehicles in Household |
| Scandinavians | 100.0 /100 | #37 | Exceptional 8.0% |
| Sioux | 100.0 /100 | #38 | Exceptional 8.0% |
| Spanish Americans | 100.0 /100 | #39 | Exceptional 8.0% |
| Spanish | 100.0 /100 | #40 | Exceptional 7.9% |
| Pima | 100.0 /100 | #41 | Exceptional 7.9% |
| Salvadorans | 100.0 /100 | #42 | Exceptional 7.8% |
| Fijians | 100.0 /100 | #43 | Exceptional 7.8% |
| Bhutanese | 100.0 /100 | #44 | Exceptional 7.8% |
| Choctaw | 100.0 /100 | #45 | Exceptional 7.8% |
| Crow | 100.0 /100 | #46 | Exceptional 7.8% |
| Osage | 100.0 /100 | #47 | Exceptional 7.8% |
| Swiss | 100.0 /100 | #48 | Exceptional 7.8% |
| Cherokee | 100.0 /100 | #49 | Exceptional 7.7% |
| Immigrants | El Salvador | 100.0 /100 | #50 | Exceptional 7.7% |
| Immigrants | Laos | 100.0 /100 | #51 | Exceptional 7.7% |