Slavic vs Guamanian/Chamorro Single Male Poverty
COMPARE
Slavic
Guamanian/Chamorro
Single Male Poverty
Single Male Poverty Comparison
Slavs
Guamanians/Chamorros
13.3%
SINGLE MALE POVERTY
5.3/ 100
METRIC RATING
231st/ 347
METRIC RANK
12.2%
SINGLE MALE POVERTY
97.4/ 100
METRIC RATING
98th/ 347
METRIC RANK
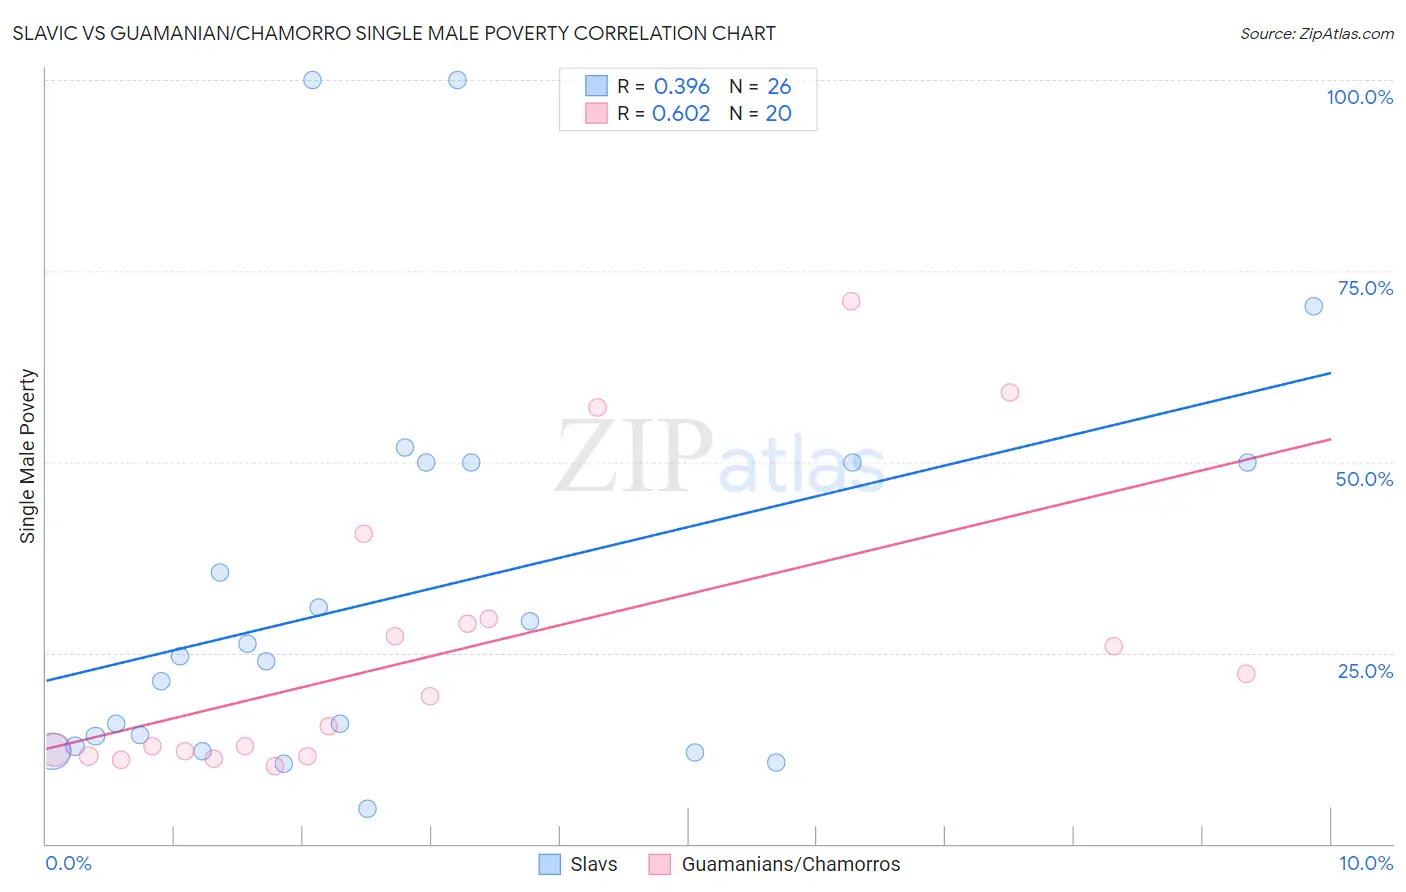
Slavic vs Guamanian/Chamorro Single Male Poverty Correlation Chart
The statistical analysis conducted on geographies consisting of 243,137,231 people shows a mild positive correlation between the proportion of Slavs and poverty level among single males in the United States with a correlation coefficient (R) of 0.396 and weighted average of 13.3%. Similarly, the statistical analysis conducted on geographies consisting of 207,536,153 people shows a significant positive correlation between the proportion of Guamanians/Chamorros and poverty level among single males in the United States with a correlation coefficient (R) of 0.602 and weighted average of 12.2%, a difference of 9.0%.
Single Male Poverty Correlation Summary
| Measurement | Slavic | Guamanian/Chamorro |
| Minimum | 4.5% | 10.2% |
| Maximum | 100.0% | 71.1% |
| Range | 95.5% | 60.8% |
| Mean | 32.6% | 25.1% |
| Median | 24.2% | 17.3% |
| Interquartile 25% (IQ1) | 12.8% | 11.8% |
| Interquartile 75% (IQ3) | 50.0% | 29.1% |
| Interquartile Range (IQR) | 37.2% | 17.3% |
| Standard Deviation (Sample) | 26.2% | 18.3% |
| Standard Deviation (Population) | 25.6% | 17.8% |
Similar Demographics by Single Male Poverty
Demographics Similar to Slavs by Single Male Poverty
In terms of single male poverty, the demographic groups most similar to Slavs are Immigrants from Caribbean (13.3%, a difference of 0.090%), Ghanaian (13.3%, a difference of 0.18%), European (13.3%, a difference of 0.20%), Lebanese (13.2%, a difference of 0.30%), and Haitian (13.2%, a difference of 0.38%).
| Demographics | Rating | Rank | Single Male Poverty |
| Somalis | 9.1 /100 | #224 | Tragic 13.2% |
| Immigrants | Denmark | 8.7 /100 | #225 | Tragic 13.2% |
| Jamaicans | 7.7 /100 | #226 | Tragic 13.2% |
| Haitians | 7.0 /100 | #227 | Tragic 13.2% |
| Lebanese | 6.6 /100 | #228 | Tragic 13.2% |
| Europeans | 6.2 /100 | #229 | Tragic 13.3% |
| Ghanaians | 6.1 /100 | #230 | Tragic 13.3% |
| Slavs | 5.3 /100 | #231 | Tragic 13.3% |
| Immigrants | Caribbean | 5.0 /100 | #232 | Tragic 13.3% |
| British | 4.0 /100 | #233 | Tragic 13.3% |
| Canadians | 4.0 /100 | #234 | Tragic 13.3% |
| Bangladeshis | 3.7 /100 | #235 | Tragic 13.3% |
| Luxembourgers | 3.6 /100 | #236 | Tragic 13.4% |
| British West Indians | 3.4 /100 | #237 | Tragic 13.4% |
| Immigrants | Ghana | 3.2 /100 | #238 | Tragic 13.4% |
Demographics Similar to Guamanians/Chamorros by Single Male Poverty
In terms of single male poverty, the demographic groups most similar to Guamanians/Chamorros are Immigrants from Italy (12.2%, a difference of 0.0%), Immigrants from Cuba (12.2%, a difference of 0.040%), Immigrants from Sweden (12.2%, a difference of 0.050%), Immigrants from Australia (12.2%, a difference of 0.15%), and Immigrants from Latvia (12.2%, a difference of 0.19%).
| Demographics | Rating | Rank | Single Male Poverty |
| Immigrants | Turkey | 98.2 /100 | #91 | Exceptional 12.1% |
| Spanish American Indians | 98.0 /100 | #92 | Exceptional 12.1% |
| Immigrants | Bosnia and Herzegovina | 97.9 /100 | #93 | Exceptional 12.1% |
| Colombians | 97.8 /100 | #94 | Exceptional 12.2% |
| Mongolians | 97.7 /100 | #95 | Exceptional 12.2% |
| Immigrants | Sweden | 97.5 /100 | #96 | Exceptional 12.2% |
| Immigrants | Italy | 97.4 /100 | #97 | Exceptional 12.2% |
| Guamanians/Chamorros | 97.4 /100 | #98 | Exceptional 12.2% |
| Immigrants | Cuba | 97.3 /100 | #99 | Exceptional 12.2% |
| Immigrants | Australia | 97.1 /100 | #100 | Exceptional 12.2% |
| Immigrants | Latvia | 97.0 /100 | #101 | Exceptional 12.2% |
| Immigrants | Europe | 97.0 /100 | #102 | Exceptional 12.2% |
| Immigrants | Armenia | 96.7 /100 | #103 | Exceptional 12.2% |
| Immigrants | Kazakhstan | 96.7 /100 | #104 | Exceptional 12.2% |
| Jordanians | 95.9 /100 | #105 | Exceptional 12.3% |