Slavic vs Guamanian/Chamorro In Labor Force | Age 16-19
COMPARE
Slavic
Guamanian/Chamorro
In Labor Force | Age 16-19
In Labor Force | Age 16-19 Comparison
Slavs
Guamanians/Chamorros
40.4%
IN LABOR FORCE | AGE 16-19
100.0/ 100
METRIC RATING
59th/ 347
METRIC RANK
38.2%
IN LABOR FORCE | AGE 16-19
97.4/ 100
METRIC RATING
122nd/ 347
METRIC RANK
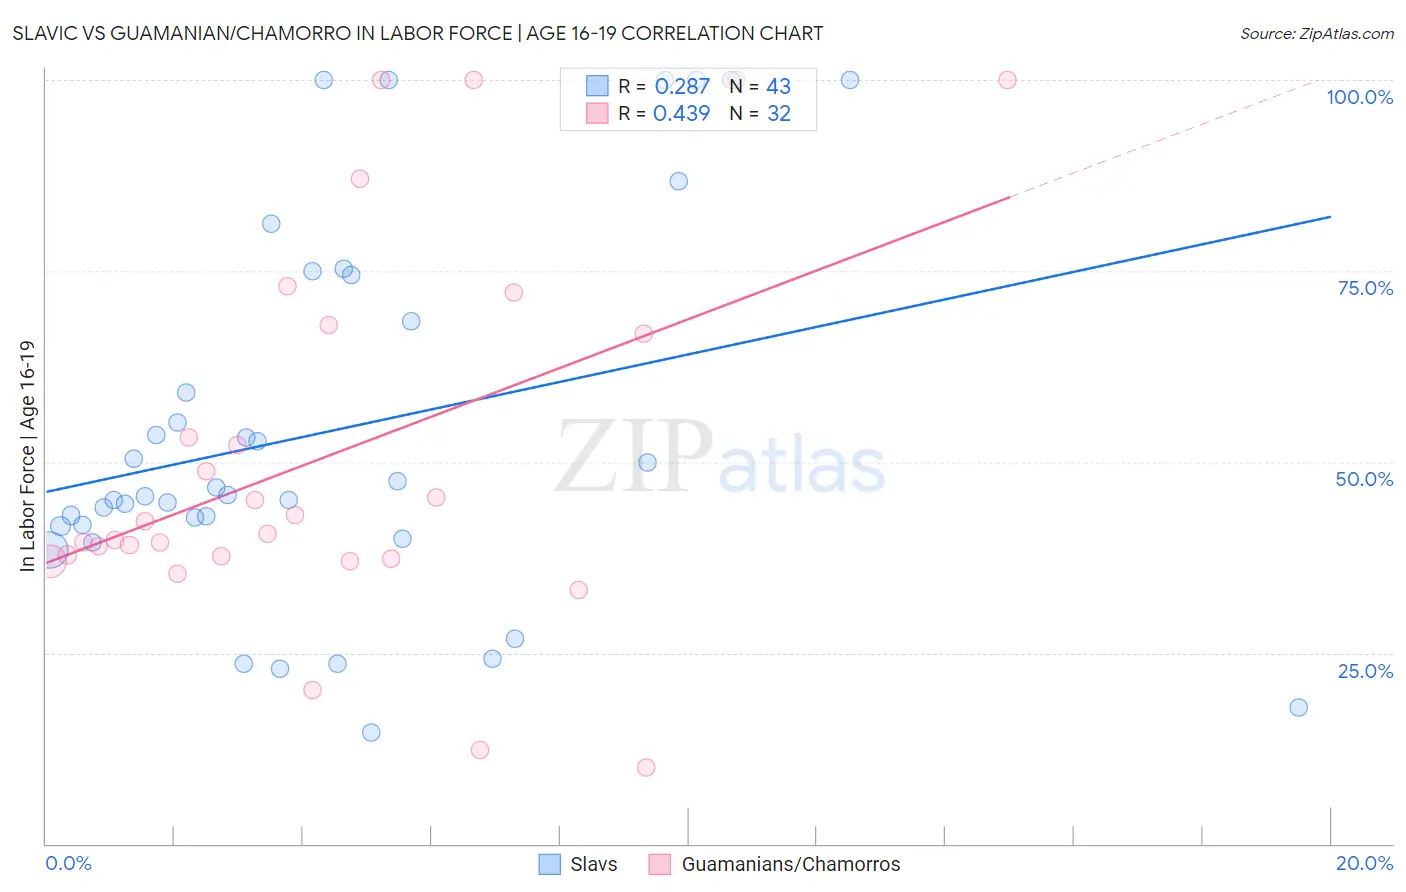
Slavic vs Guamanian/Chamorro In Labor Force | Age 16-19 Correlation Chart
The statistical analysis conducted on geographies consisting of 270,628,141 people shows a weak positive correlation between the proportion of Slavs and labor force participation rate among population between the ages 16 and 19 in the United States with a correlation coefficient (R) of 0.287 and weighted average of 40.4%. Similarly, the statistical analysis conducted on geographies consisting of 221,811,723 people shows a moderate positive correlation between the proportion of Guamanians/Chamorros and labor force participation rate among population between the ages 16 and 19 in the United States with a correlation coefficient (R) of 0.439 and weighted average of 38.2%, a difference of 5.6%.
In Labor Force | Age 16-19 Correlation Summary
| Measurement | Slavic | Guamanian/Chamorro |
| Minimum | 14.6% | 10.0% |
| Maximum | 100.0% | 100.0% |
| Range | 85.4% | 90.0% |
| Mean | 54.1% | 51.0% |
| Median | 45.6% | 41.4% |
| Interquartile 25% (IQ1) | 41.6% | 37.5% |
| Interquartile 75% (IQ3) | 74.5% | 67.3% |
| Interquartile Range (IQR) | 32.9% | 29.8% |
| Standard Deviation (Sample) | 24.6% | 24.8% |
| Standard Deviation (Population) | 24.3% | 24.4% |
Similar Demographics by In Labor Force | Age 16-19
Demographics Similar to Slavs by In Labor Force | Age 16-19
In terms of in labor force | age 16-19, the demographic groups most similar to Slavs are Immigrants from Eastern Africa (40.4%, a difference of 0.040%), Aleut (40.4%, a difference of 0.13%), Lithuanian (40.4%, a difference of 0.15%), Fijian (40.4%, a difference of 0.17%), and American (40.3%, a difference of 0.19%).
| Demographics | Rating | Rank | In Labor Force | Age 16-19 |
| Immigrants | Laos | 100.0 /100 | #52 | Exceptional 40.6% |
| Immigrants | Kenya | 100.0 /100 | #53 | Exceptional 40.5% |
| Tlingit-Haida | 100.0 /100 | #54 | Exceptional 40.5% |
| British | 100.0 /100 | #55 | Exceptional 40.5% |
| Fijians | 100.0 /100 | #56 | Exceptional 40.4% |
| Lithuanians | 100.0 /100 | #57 | Exceptional 40.4% |
| Aleuts | 100.0 /100 | #58 | Exceptional 40.4% |
| Slavs | 100.0 /100 | #59 | Exceptional 40.4% |
| Immigrants | Eastern Africa | 100.0 /100 | #60 | Exceptional 40.4% |
| Americans | 100.0 /100 | #61 | Exceptional 40.3% |
| Cherokee | 100.0 /100 | #62 | Exceptional 40.2% |
| Northern Europeans | 100.0 /100 | #63 | Exceptional 40.2% |
| Immigrants | Micronesia | 100.0 /100 | #64 | Exceptional 40.2% |
| Kenyans | 100.0 /100 | #65 | Exceptional 40.1% |
| Immigrants | Nonimmigrants | 100.0 /100 | #66 | Exceptional 40.1% |
Demographics Similar to Guamanians/Chamorros by In Labor Force | Age 16-19
In terms of in labor force | age 16-19, the demographic groups most similar to Guamanians/Chamorros are Ethiopian (38.2%, a difference of 0.030%), Ukrainian (38.3%, a difference of 0.13%), Assyrian/Chaldean/Syriac (38.3%, a difference of 0.22%), Immigrants from Nepal (38.3%, a difference of 0.23%), and Chickasaw (38.3%, a difference of 0.25%).
| Demographics | Rating | Rank | In Labor Force | Age 16-19 |
| Bulgarians | 97.9 /100 | #115 | Exceptional 38.3% |
| Colville | 97.9 /100 | #116 | Exceptional 38.3% |
| Chickasaw | 97.8 /100 | #117 | Exceptional 38.3% |
| Immigrants | Nepal | 97.8 /100 | #118 | Exceptional 38.3% |
| Assyrians/Chaldeans/Syriacs | 97.8 /100 | #119 | Exceptional 38.3% |
| Ukrainians | 97.6 /100 | #120 | Exceptional 38.3% |
| Ethiopians | 97.4 /100 | #121 | Exceptional 38.2% |
| Guamanians/Chamorros | 97.4 /100 | #122 | Exceptional 38.2% |
| Seminole | 96.7 /100 | #123 | Exceptional 38.1% |
| Immigrants | England | 96.4 /100 | #124 | Exceptional 38.1% |
| Immigrants | Africa | 96.1 /100 | #125 | Exceptional 38.0% |
| Africans | 95.6 /100 | #126 | Exceptional 38.0% |
| Choctaw | 95.6 /100 | #127 | Exceptional 38.0% |
| New Zealanders | 95.6 /100 | #128 | Exceptional 38.0% |
| Spaniards | 95.5 /100 | #129 | Exceptional 38.0% |