Delaware vs Guamanian/Chamorro 4 or more Vehicles in Household
COMPARE
Delaware
Guamanian/Chamorro
4 or more Vehicles in Household
4 or more Vehicles in Household Comparison
Delaware
Guamanians/Chamorros
7.2%
4 OR MORE VEHICLES IN HOUSEHOLD
99.6/ 100
METRIC RATING
87th/ 347
METRIC RANK
8.1%
4 OR MORE VEHICLES IN HOUSEHOLD
100.0/ 100
METRIC RATING
35th/ 347
METRIC RANK
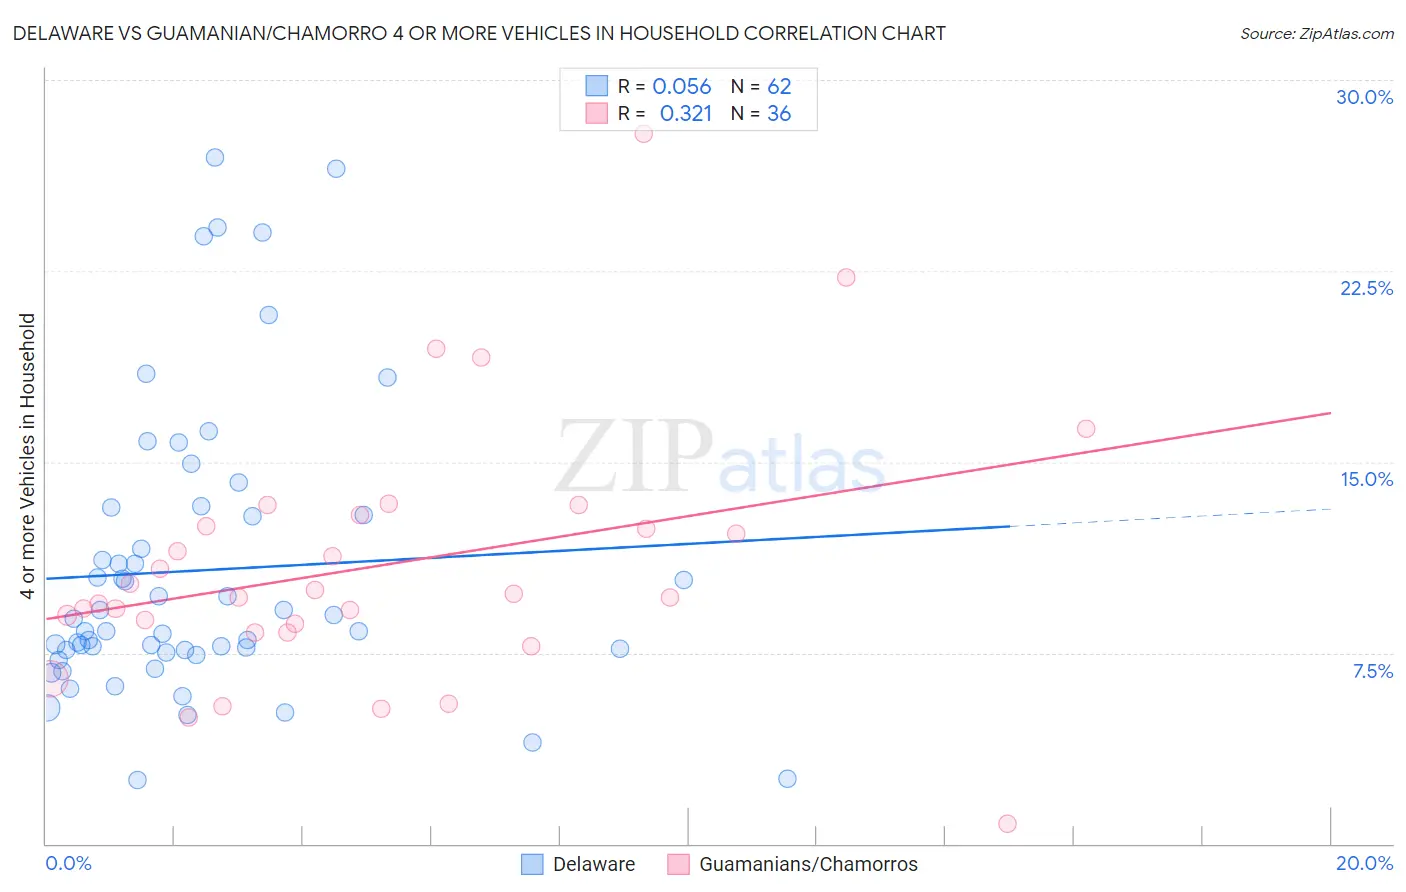
Delaware vs Guamanian/Chamorro 4 or more Vehicles in Household Correlation Chart
The statistical analysis conducted on geographies consisting of 96,077,939 people shows a slight positive correlation between the proportion of Delaware and percentage of households with 4 or more vehicles available in the United States with a correlation coefficient (R) of 0.056 and weighted average of 7.2%. Similarly, the statistical analysis conducted on geographies consisting of 221,490,989 people shows a mild positive correlation between the proportion of Guamanians/Chamorros and percentage of households with 4 or more vehicles available in the United States with a correlation coefficient (R) of 0.321 and weighted average of 8.1%, a difference of 11.6%.
4 or more Vehicles in Household Correlation Summary
| Measurement | Delaware | Guamanian/Chamorro |
| Minimum | 2.5% | 0.81% |
| Maximum | 27.0% | 27.9% |
| Range | 24.5% | 27.1% |
| Mean | 10.7% | 10.9% |
| Median | 8.6% | 9.7% |
| Interquartile 25% (IQ1) | 7.6% | 8.5% |
| Interquartile 75% (IQ3) | 12.9% | 12.7% |
| Interquartile Range (IQR) | 5.3% | 4.2% |
| Standard Deviation (Sample) | 5.7% | 5.1% |
| Standard Deviation (Population) | 5.6% | 5.0% |
Similar Demographics by 4 or more Vehicles in Household
Demographics Similar to Delaware by 4 or more Vehicles in Household
In terms of 4 or more vehicles in household, the demographic groups most similar to Delaware are Nonimmigrants (7.2%, a difference of 0.020%), Immigrants from Indonesia (7.2%, a difference of 0.060%), Cree (7.2%, a difference of 0.24%), British (7.2%, a difference of 0.35%), and Afghan (7.3%, a difference of 0.41%).
| Demographics | Rating | Rank | 4 or more Vehicles in Household |
| Alaska Natives | 99.8 /100 | #80 | Exceptional 7.3% |
| Finns | 99.8 /100 | #81 | Exceptional 7.3% |
| Northern Europeans | 99.8 /100 | #82 | Exceptional 7.3% |
| Potawatomi | 99.7 /100 | #83 | Exceptional 7.3% |
| Afghans | 99.7 /100 | #84 | Exceptional 7.3% |
| Cree | 99.7 /100 | #85 | Exceptional 7.2% |
| Immigrants | Indonesia | 99.6 /100 | #86 | Exceptional 7.2% |
| Delaware | 99.6 /100 | #87 | Exceptional 7.2% |
| Immigrants | Nonimmigrants | 99.6 /100 | #88 | Exceptional 7.2% |
| British | 99.6 /100 | #89 | Exceptional 7.2% |
| Creek | 99.6 /100 | #90 | Exceptional 7.2% |
| Assyrians/Chaldeans/Syriacs | 99.4 /100 | #91 | Exceptional 7.2% |
| Immigrants | Latin America | 99.4 /100 | #92 | Exceptional 7.1% |
| Immigrants | Afghanistan | 99.3 /100 | #93 | Exceptional 7.1% |
| Dutch West Indians | 99.3 /100 | #94 | Exceptional 7.1% |
Demographics Similar to Guamanians/Chamorros by 4 or more Vehicles in Household
In terms of 4 or more vehicles in household, the demographic groups most similar to Guamanians/Chamorros are Alaskan Athabascan (8.1%, a difference of 0.20%), Norwegian (8.0%, a difference of 0.79%), Yaqui (8.1%, a difference of 0.80%), Scandinavian (8.0%, a difference of 0.96%), and Sioux (8.0%, a difference of 0.99%).
| Demographics | Rating | Rank | 4 or more Vehicles in Household |
| Cheyenne | 100.0 /100 | #28 | Exceptional 8.3% |
| Immigrants | South Eastern Asia | 100.0 /100 | #29 | Exceptional 8.2% |
| Navajo | 100.0 /100 | #30 | Exceptional 8.2% |
| Natives/Alaskans | 100.0 /100 | #31 | Exceptional 8.2% |
| Marshallese | 100.0 /100 | #32 | Exceptional 8.1% |
| Yaqui | 100.0 /100 | #33 | Exceptional 8.1% |
| Alaskan Athabascans | 100.0 /100 | #34 | Exceptional 8.1% |
| Guamanians/Chamorros | 100.0 /100 | #35 | Exceptional 8.1% |
| Norwegians | 100.0 /100 | #36 | Exceptional 8.0% |
| Scandinavians | 100.0 /100 | #37 | Exceptional 8.0% |
| Sioux | 100.0 /100 | #38 | Exceptional 8.0% |
| Spanish Americans | 100.0 /100 | #39 | Exceptional 8.0% |
| Spanish | 100.0 /100 | #40 | Exceptional 7.9% |
| Pima | 100.0 /100 | #41 | Exceptional 7.9% |
| Salvadorans | 100.0 /100 | #42 | Exceptional 7.8% |