Immigrants from Sweden vs Immigrants from Nepal 2 or more Vehicles in Household
COMPARE
Immigrants from Sweden
Immigrants from Nepal
2 or more Vehicles in Household
2 or more Vehicles in Household Comparison
Immigrants from Sweden
Immigrants from Nepal
55.2%
2 OR MORE VEHICLES IN HOUSEHOLD
45.3/ 100
METRIC RATING
178th/ 347
METRIC RANK
53.5%
2 OR MORE VEHICLES IN HOUSEHOLD
3.6/ 100
METRIC RATING
230th/ 347
METRIC RANK
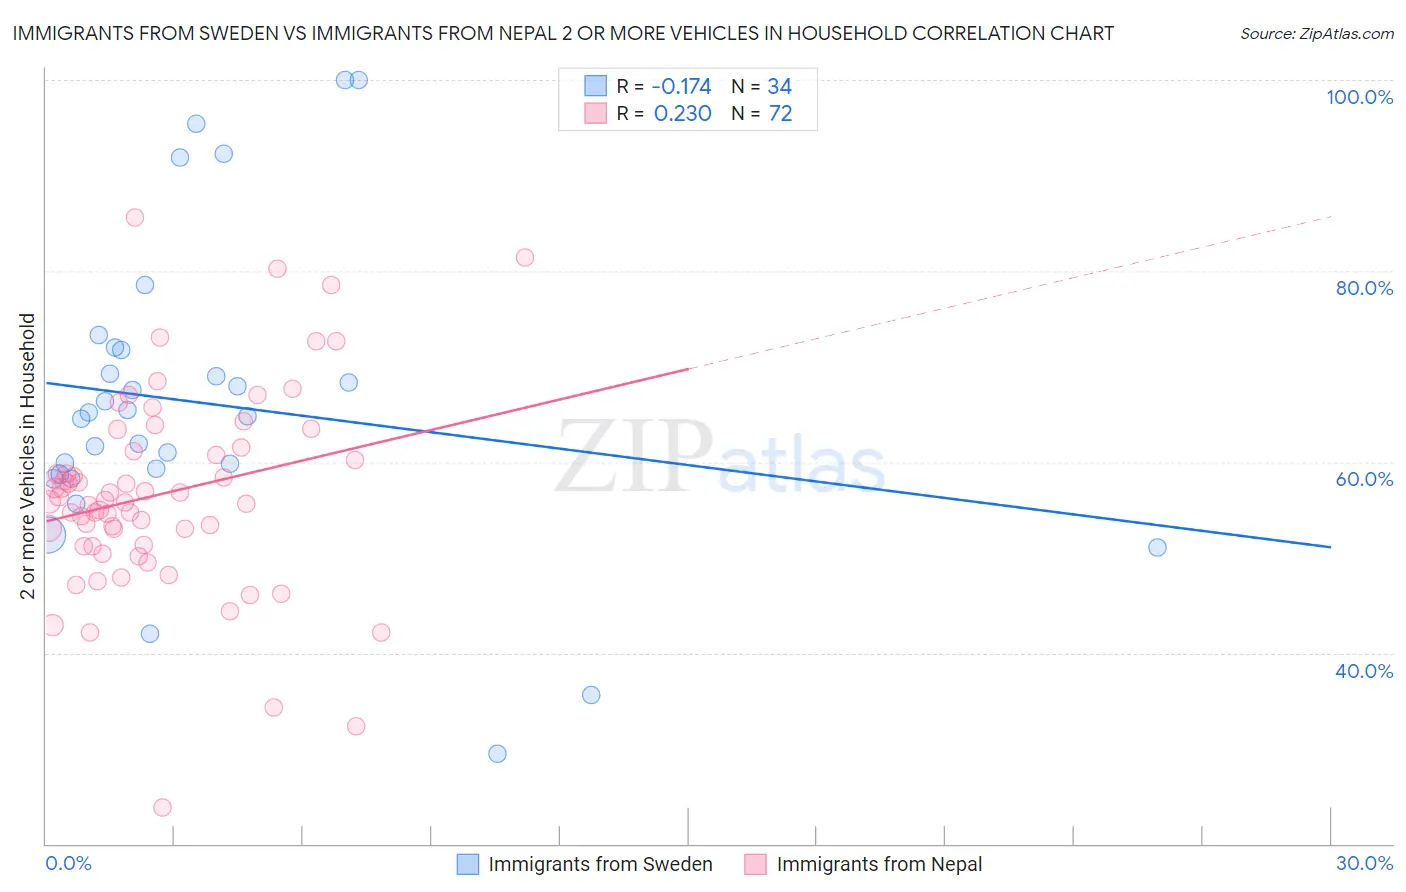
Immigrants from Sweden vs Immigrants from Nepal 2 or more Vehicles in Household Correlation Chart
The statistical analysis conducted on geographies consisting of 164,706,538 people shows a poor negative correlation between the proportion of Immigrants from Sweden and percentage of households with 2 or more vehicles available in the United States with a correlation coefficient (R) of -0.174 and weighted average of 55.2%. Similarly, the statistical analysis conducted on geographies consisting of 186,595,631 people shows a weak positive correlation between the proportion of Immigrants from Nepal and percentage of households with 2 or more vehicles available in the United States with a correlation coefficient (R) of 0.230 and weighted average of 53.5%, a difference of 3.2%.
2 or more Vehicles in Household Correlation Summary
| Measurement | Immigrants from Sweden | Immigrants from Nepal |
| Minimum | 29.4% | 23.8% |
| Maximum | 100.0% | 85.6% |
| Range | 70.6% | 61.8% |
| Mean | 66.1% | 56.7% |
| Median | 65.0% | 55.9% |
| Interquartile 25% (IQ1) | 58.7% | 51.2% |
| Interquartile 75% (IQ3) | 71.7% | 61.3% |
| Interquartile Range (IQR) | 13.0% | 10.1% |
| Standard Deviation (Sample) | 16.1% | 10.6% |
| Standard Deviation (Population) | 15.9% | 10.5% |
Similar Demographics by 2 or more Vehicles in Household
Demographics Similar to Immigrants from Sweden by 2 or more Vehicles in Household
In terms of 2 or more vehicles in household, the demographic groups most similar to Immigrants from Sweden are Menominee (55.3%, a difference of 0.040%), Immigrants from Cuba (55.3%, a difference of 0.070%), Alaskan Athabascan (55.2%, a difference of 0.10%), Immigrants from Denmark (55.3%, a difference of 0.17%), and Navajo (55.3%, a difference of 0.19%).
| Demographics | Rating | Rank | 2 or more Vehicles in Household |
| Immigrants | Costa Rica | 54.4 /100 | #171 | Average 55.4% |
| Immigrants | Nicaragua | 51.6 /100 | #172 | Average 55.4% |
| Immigrants | Western Europe | 51.4 /100 | #173 | Average 55.4% |
| Navajo | 50.0 /100 | #174 | Average 55.3% |
| Immigrants | Denmark | 49.4 /100 | #175 | Average 55.3% |
| Immigrants | Cuba | 47.0 /100 | #176 | Average 55.3% |
| Menominee | 46.2 /100 | #177 | Average 55.3% |
| Immigrants | Sweden | 45.3 /100 | #178 | Average 55.2% |
| Alaskan Athabascans | 42.9 /100 | #179 | Average 55.2% |
| Immigrants | Kenya | 40.4 /100 | #180 | Average 55.1% |
| Immigrants | Micronesia | 38.2 /100 | #181 | Fair 55.1% |
| Cree | 38.2 /100 | #182 | Fair 55.1% |
| Immigrants | Cameroon | 37.3 /100 | #183 | Fair 55.1% |
| Apache | 36.7 /100 | #184 | Fair 55.1% |
| Arabs | 35.9 /100 | #185 | Fair 55.0% |
Demographics Similar to Immigrants from Nepal by 2 or more Vehicles in Household
In terms of 2 or more vehicles in household, the demographic groups most similar to Immigrants from Nepal are Panamanian (53.5%, a difference of 0.050%), Immigrants from Turkey (53.6%, a difference of 0.060%), Alaska Native (53.6%, a difference of 0.080%), Immigrants from Guatemala (53.5%, a difference of 0.12%), and Ugandan (53.5%, a difference of 0.13%).
| Demographics | Rating | Rank | 2 or more Vehicles in Household |
| Immigrants | Bosnia and Herzegovina | 5.5 /100 | #223 | Tragic 53.8% |
| Brazilians | 5.3 /100 | #224 | Tragic 53.8% |
| Immigrants | Egypt | 5.2 /100 | #225 | Tragic 53.8% |
| Immigrants | Eastern Africa | 5.1 /100 | #226 | Tragic 53.7% |
| Sudanese | 4.1 /100 | #227 | Tragic 53.6% |
| Alaska Natives | 3.9 /100 | #228 | Tragic 53.6% |
| Immigrants | Turkey | 3.8 /100 | #229 | Tragic 53.6% |
| Immigrants | Nepal | 3.6 /100 | #230 | Tragic 53.5% |
| Panamanians | 3.4 /100 | #231 | Tragic 53.5% |
| Immigrants | Guatemala | 3.2 /100 | #232 | Tragic 53.5% |
| Ugandans | 3.2 /100 | #233 | Tragic 53.5% |
| Immigrants | Switzerland | 3.0 /100 | #234 | Tragic 53.4% |
| Immigrants | Middle Africa | 3.0 /100 | #235 | Tragic 53.4% |
| Indonesians | 2.7 /100 | #236 | Tragic 53.4% |
| Macedonians | 2.4 /100 | #237 | Tragic 53.3% |