Immigrants from Dominican Republic vs Immigrants from Nepal 2 or more Vehicles in Household
COMPARE
Immigrants from Dominican Republic
Immigrants from Nepal
2 or more Vehicles in Household
2 or more Vehicles in Household Comparison
Immigrants from Dominican Republic
Immigrants from Nepal
33.2%
2 OR MORE VEHICLES IN HOUSEHOLD
0.0/ 100
METRIC RATING
345th/ 347
METRIC RANK
53.5%
2 OR MORE VEHICLES IN HOUSEHOLD
3.6/ 100
METRIC RATING
230th/ 347
METRIC RANK
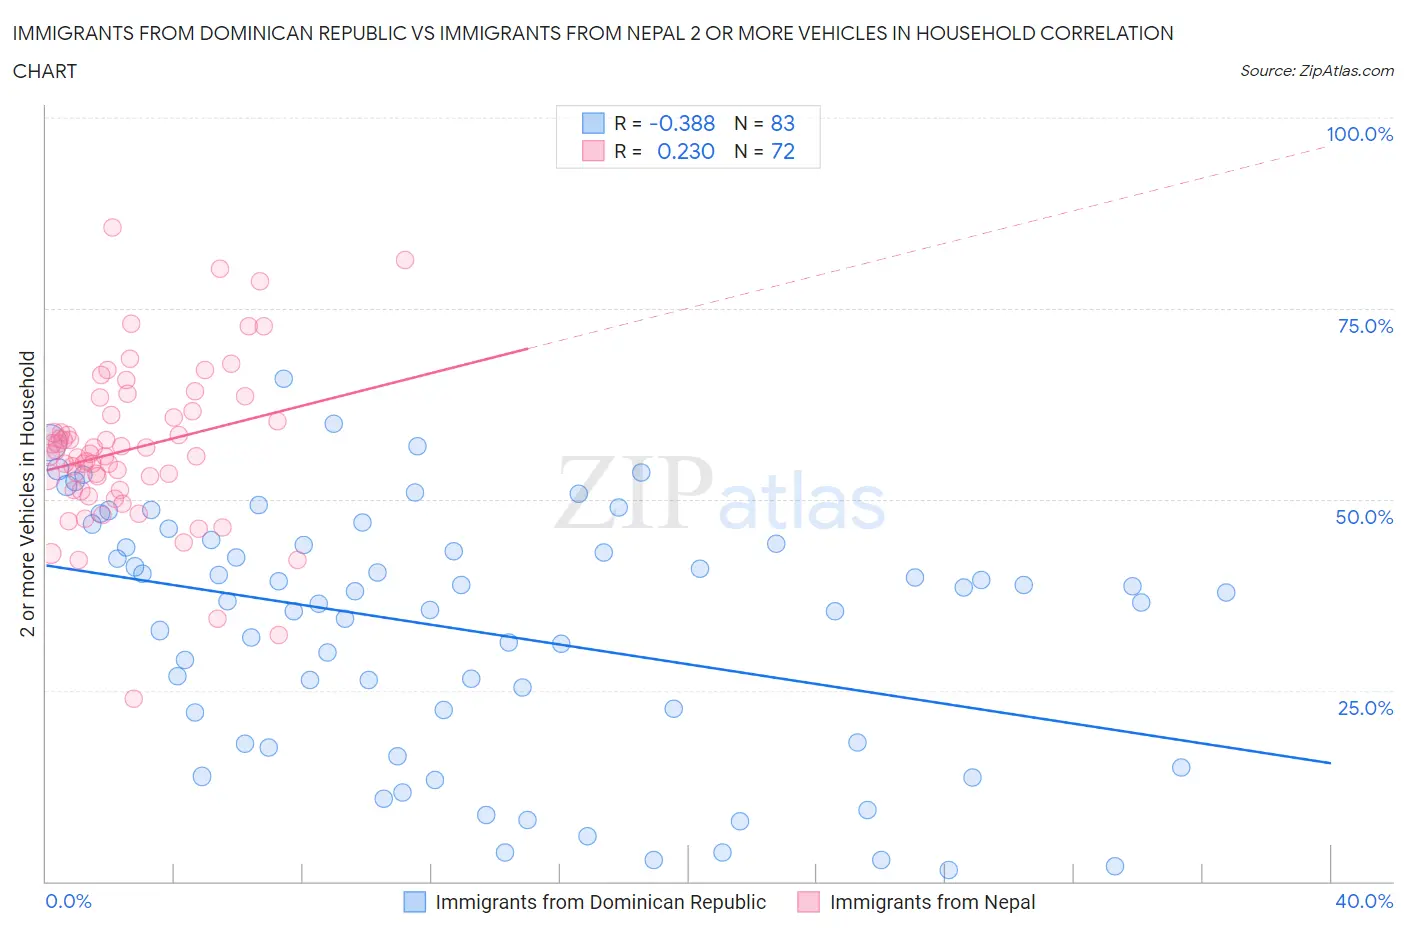
Immigrants from Dominican Republic vs Immigrants from Nepal 2 or more Vehicles in Household Correlation Chart
The statistical analysis conducted on geographies consisting of 274,967,737 people shows a mild negative correlation between the proportion of Immigrants from Dominican Republic and percentage of households with 2 or more vehicles available in the United States with a correlation coefficient (R) of -0.388 and weighted average of 33.2%. Similarly, the statistical analysis conducted on geographies consisting of 186,595,631 people shows a weak positive correlation between the proportion of Immigrants from Nepal and percentage of households with 2 or more vehicles available in the United States with a correlation coefficient (R) of 0.230 and weighted average of 53.5%, a difference of 61.1%.
2 or more Vehicles in Household Correlation Summary
| Measurement | Immigrants from Dominican Republic | Immigrants from Nepal |
| Minimum | 1.5% | 23.8% |
| Maximum | 65.8% | 85.6% |
| Range | 64.3% | 61.8% |
| Mean | 32.9% | 56.7% |
| Median | 36.6% | 55.9% |
| Interquartile 25% (IQ1) | 18.1% | 51.2% |
| Interquartile 75% (IQ3) | 44.2% | 61.3% |
| Interquartile Range (IQR) | 26.1% | 10.1% |
| Standard Deviation (Sample) | 16.2% | 10.6% |
| Standard Deviation (Population) | 16.1% | 10.5% |
Similar Demographics by 2 or more Vehicles in Household
Demographics Similar to Immigrants from Dominican Republic by 2 or more Vehicles in Household
In terms of 2 or more vehicles in household, the demographic groups most similar to Immigrants from Dominican Republic are Yup'ik (34.9%, a difference of 5.2%), Immigrants from Guyana (35.0%, a difference of 5.3%), Dominican (35.3%, a difference of 6.3%), Guyanese (35.4%, a difference of 6.5%), and British West Indian (35.4%, a difference of 6.5%).
| Demographics | Rating | Rank | 2 or more Vehicles in Household |
| Immigrants | Ecuador | 0.0 /100 | #333 | Tragic 40.5% |
| Immigrants | Trinidad and Tobago | 0.0 /100 | #334 | Tragic 40.3% |
| Immigrants | Bangladesh | 0.0 /100 | #335 | Tragic 38.8% |
| Vietnamese | 0.0 /100 | #336 | Tragic 38.5% |
| Barbadians | 0.0 /100 | #337 | Tragic 38.3% |
| Immigrants | Uzbekistan | 0.0 /100 | #338 | Tragic 37.9% |
| Immigrants | Barbados | 0.0 /100 | #339 | Tragic 35.8% |
| British West Indians | 0.0 /100 | #340 | Tragic 35.4% |
| Guyanese | 0.0 /100 | #341 | Tragic 35.4% |
| Dominicans | 0.0 /100 | #342 | Tragic 35.3% |
| Immigrants | Guyana | 0.0 /100 | #343 | Tragic 35.0% |
| Yup'ik | 0.0 /100 | #344 | Tragic 34.9% |
| Immigrants | Dominican Republic | 0.0 /100 | #345 | Tragic 33.2% |
| Immigrants | St. Vincent and the Grenadines | 0.0 /100 | #346 | Tragic 31.0% |
| Immigrants | Grenada | 0.0 /100 | #347 | Tragic 28.7% |
Demographics Similar to Immigrants from Nepal by 2 or more Vehicles in Household
In terms of 2 or more vehicles in household, the demographic groups most similar to Immigrants from Nepal are Panamanian (53.5%, a difference of 0.050%), Immigrants from Turkey (53.6%, a difference of 0.060%), Alaska Native (53.6%, a difference of 0.080%), Immigrants from Guatemala (53.5%, a difference of 0.12%), and Ugandan (53.5%, a difference of 0.13%).
| Demographics | Rating | Rank | 2 or more Vehicles in Household |
| Immigrants | Bosnia and Herzegovina | 5.5 /100 | #223 | Tragic 53.8% |
| Brazilians | 5.3 /100 | #224 | Tragic 53.8% |
| Immigrants | Egypt | 5.2 /100 | #225 | Tragic 53.8% |
| Immigrants | Eastern Africa | 5.1 /100 | #226 | Tragic 53.7% |
| Sudanese | 4.1 /100 | #227 | Tragic 53.6% |
| Alaska Natives | 3.9 /100 | #228 | Tragic 53.6% |
| Immigrants | Turkey | 3.8 /100 | #229 | Tragic 53.6% |
| Immigrants | Nepal | 3.6 /100 | #230 | Tragic 53.5% |
| Panamanians | 3.4 /100 | #231 | Tragic 53.5% |
| Immigrants | Guatemala | 3.2 /100 | #232 | Tragic 53.5% |
| Ugandans | 3.2 /100 | #233 | Tragic 53.5% |
| Immigrants | Switzerland | 3.0 /100 | #234 | Tragic 53.4% |
| Immigrants | Middle Africa | 3.0 /100 | #235 | Tragic 53.4% |
| Indonesians | 2.7 /100 | #236 | Tragic 53.4% |
| Macedonians | 2.4 /100 | #237 | Tragic 53.3% |