Assyrian/Chaldean/Syriac vs Immigrants from Nepal 2 or more Vehicles in Household
COMPARE
Assyrian/Chaldean/Syriac
Immigrants from Nepal
2 or more Vehicles in Household
2 or more Vehicles in Household Comparison
Assyrians/Chaldeans/Syriacs
Immigrants from Nepal
60.5%
2 OR MORE VEHICLES IN HOUSEHOLD
100.0/ 100
METRIC RATING
27th/ 347
METRIC RANK
53.5%
2 OR MORE VEHICLES IN HOUSEHOLD
3.6/ 100
METRIC RATING
230th/ 347
METRIC RANK
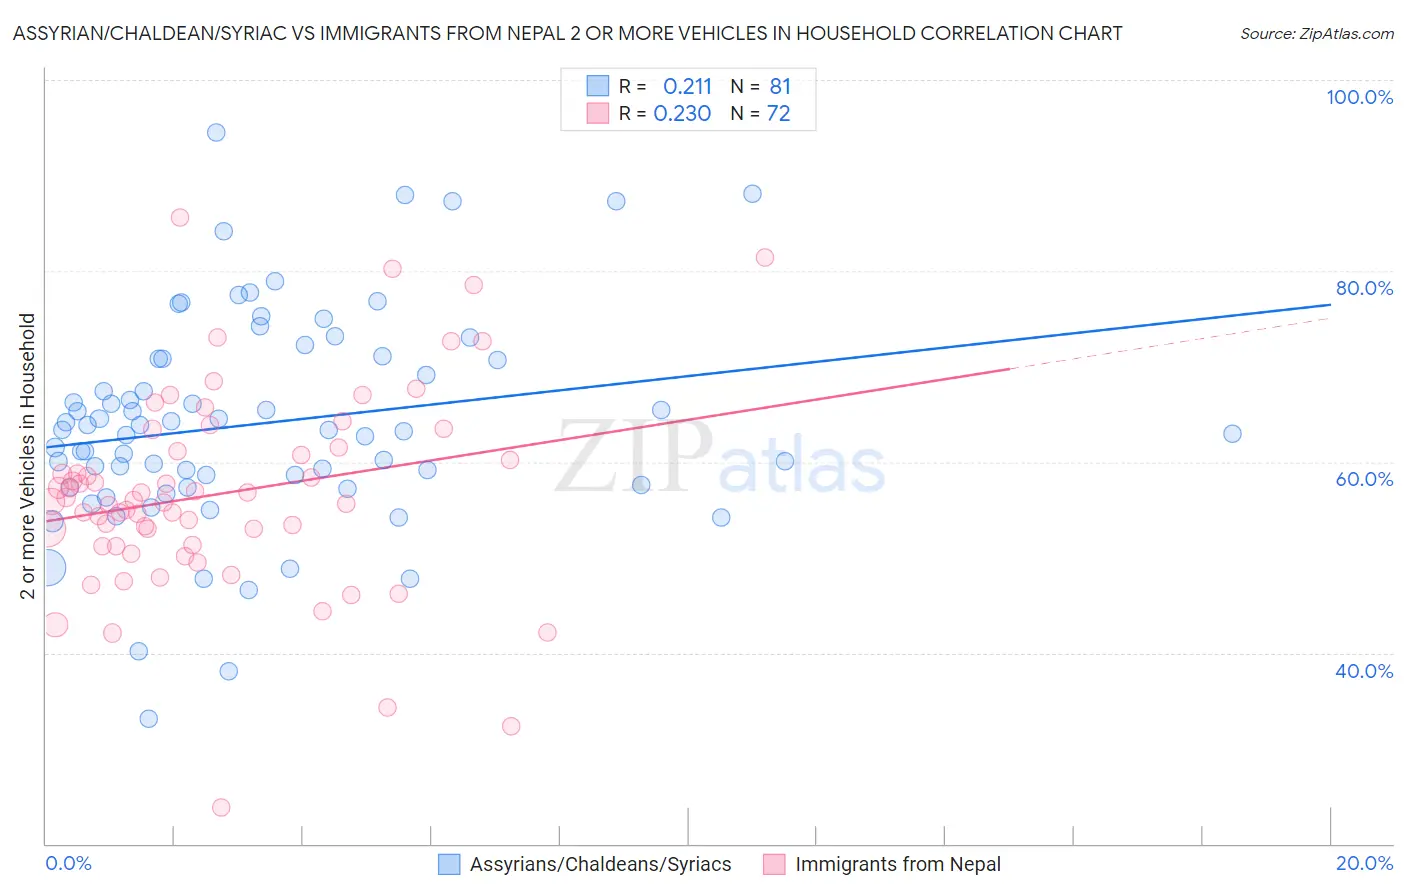
Assyrian/Chaldean/Syriac vs Immigrants from Nepal 2 or more Vehicles in Household Correlation Chart
The statistical analysis conducted on geographies consisting of 110,297,156 people shows a weak positive correlation between the proportion of Assyrians/Chaldeans/Syriacs and percentage of households with 2 or more vehicles available in the United States with a correlation coefficient (R) of 0.211 and weighted average of 60.5%. Similarly, the statistical analysis conducted on geographies consisting of 186,595,631 people shows a weak positive correlation between the proportion of Immigrants from Nepal and percentage of households with 2 or more vehicles available in the United States with a correlation coefficient (R) of 0.230 and weighted average of 53.5%, a difference of 13.1%.
2 or more Vehicles in Household Correlation Summary
| Measurement | Assyrian/Chaldean/Syriac | Immigrants from Nepal |
| Minimum | 33.1% | 23.8% |
| Maximum | 94.4% | 85.6% |
| Range | 61.3% | 61.8% |
| Mean | 64.0% | 56.7% |
| Median | 63.3% | 55.9% |
| Interquartile 25% (IQ1) | 57.5% | 51.2% |
| Interquartile 75% (IQ3) | 70.8% | 61.3% |
| Interquartile Range (IQR) | 13.3% | 10.1% |
| Standard Deviation (Sample) | 11.3% | 10.6% |
| Standard Deviation (Population) | 11.2% | 10.5% |
Similar Demographics by 2 or more Vehicles in Household
Demographics Similar to Assyrians/Chaldeans/Syriacs by 2 or more Vehicles in Household
In terms of 2 or more vehicles in household, the demographic groups most similar to Assyrians/Chaldeans/Syriacs are Guamanian/Chamorro (60.5%, a difference of 0.13%), Hawaiian (60.4%, a difference of 0.23%), Finnish (60.3%, a difference of 0.36%), Spanish American Indian (60.3%, a difference of 0.39%), and Welsh (60.8%, a difference of 0.42%).
| Demographics | Rating | Rank | 2 or more Vehicles in Household |
| Sri Lankans | 100.0 /100 | #20 | Exceptional 61.0% |
| Koreans | 100.0 /100 | #21 | Exceptional 61.0% |
| Swiss | 100.0 /100 | #22 | Exceptional 61.0% |
| Scotch-Irish | 100.0 /100 | #23 | Exceptional 60.9% |
| Immigrants | Vietnam | 100.0 /100 | #24 | Exceptional 60.9% |
| Whites/Caucasians | 100.0 /100 | #25 | Exceptional 60.8% |
| Welsh | 100.0 /100 | #26 | Exceptional 60.8% |
| Assyrians/Chaldeans/Syriacs | 100.0 /100 | #27 | Exceptional 60.5% |
| Guamanians/Chamorros | 100.0 /100 | #28 | Exceptional 60.5% |
| Hawaiians | 100.0 /100 | #29 | Exceptional 60.4% |
| Finns | 100.0 /100 | #30 | Exceptional 60.3% |
| Spanish American Indians | 100.0 /100 | #31 | Exceptional 60.3% |
| Arapaho | 100.0 /100 | #32 | Exceptional 60.2% |
| Immigrants | Mexico | 100.0 /100 | #33 | Exceptional 60.2% |
| Spanish | 100.0 /100 | #34 | Exceptional 60.2% |
Demographics Similar to Immigrants from Nepal by 2 or more Vehicles in Household
In terms of 2 or more vehicles in household, the demographic groups most similar to Immigrants from Nepal are Panamanian (53.5%, a difference of 0.050%), Immigrants from Turkey (53.6%, a difference of 0.060%), Alaska Native (53.6%, a difference of 0.080%), Immigrants from Guatemala (53.5%, a difference of 0.12%), and Ugandan (53.5%, a difference of 0.13%).
| Demographics | Rating | Rank | 2 or more Vehicles in Household |
| Immigrants | Bosnia and Herzegovina | 5.5 /100 | #223 | Tragic 53.8% |
| Brazilians | 5.3 /100 | #224 | Tragic 53.8% |
| Immigrants | Egypt | 5.2 /100 | #225 | Tragic 53.8% |
| Immigrants | Eastern Africa | 5.1 /100 | #226 | Tragic 53.7% |
| Sudanese | 4.1 /100 | #227 | Tragic 53.6% |
| Alaska Natives | 3.9 /100 | #228 | Tragic 53.6% |
| Immigrants | Turkey | 3.8 /100 | #229 | Tragic 53.6% |
| Immigrants | Nepal | 3.6 /100 | #230 | Tragic 53.5% |
| Panamanians | 3.4 /100 | #231 | Tragic 53.5% |
| Immigrants | Guatemala | 3.2 /100 | #232 | Tragic 53.5% |
| Ugandans | 3.2 /100 | #233 | Tragic 53.5% |
| Immigrants | Switzerland | 3.0 /100 | #234 | Tragic 53.4% |
| Immigrants | Middle Africa | 3.0 /100 | #235 | Tragic 53.4% |
| Indonesians | 2.7 /100 | #236 | Tragic 53.4% |
| Macedonians | 2.4 /100 | #237 | Tragic 53.3% |