Immigrants from Lebanon vs Immigrants from Panama 2 or more Vehicles in Household
COMPARE
Immigrants from Lebanon
Immigrants from Panama
2 or more Vehicles in Household
2 or more Vehicles in Household Comparison
Immigrants from Lebanon
Immigrants from Panama
57.2%
2 OR MORE VEHICLES IN HOUSEHOLD
96.8/ 100
METRIC RATING
114th/ 347
METRIC RANK
51.1%
2 OR MORE VEHICLES IN HOUSEHOLD
0.0/ 100
METRIC RATING
290th/ 347
METRIC RANK
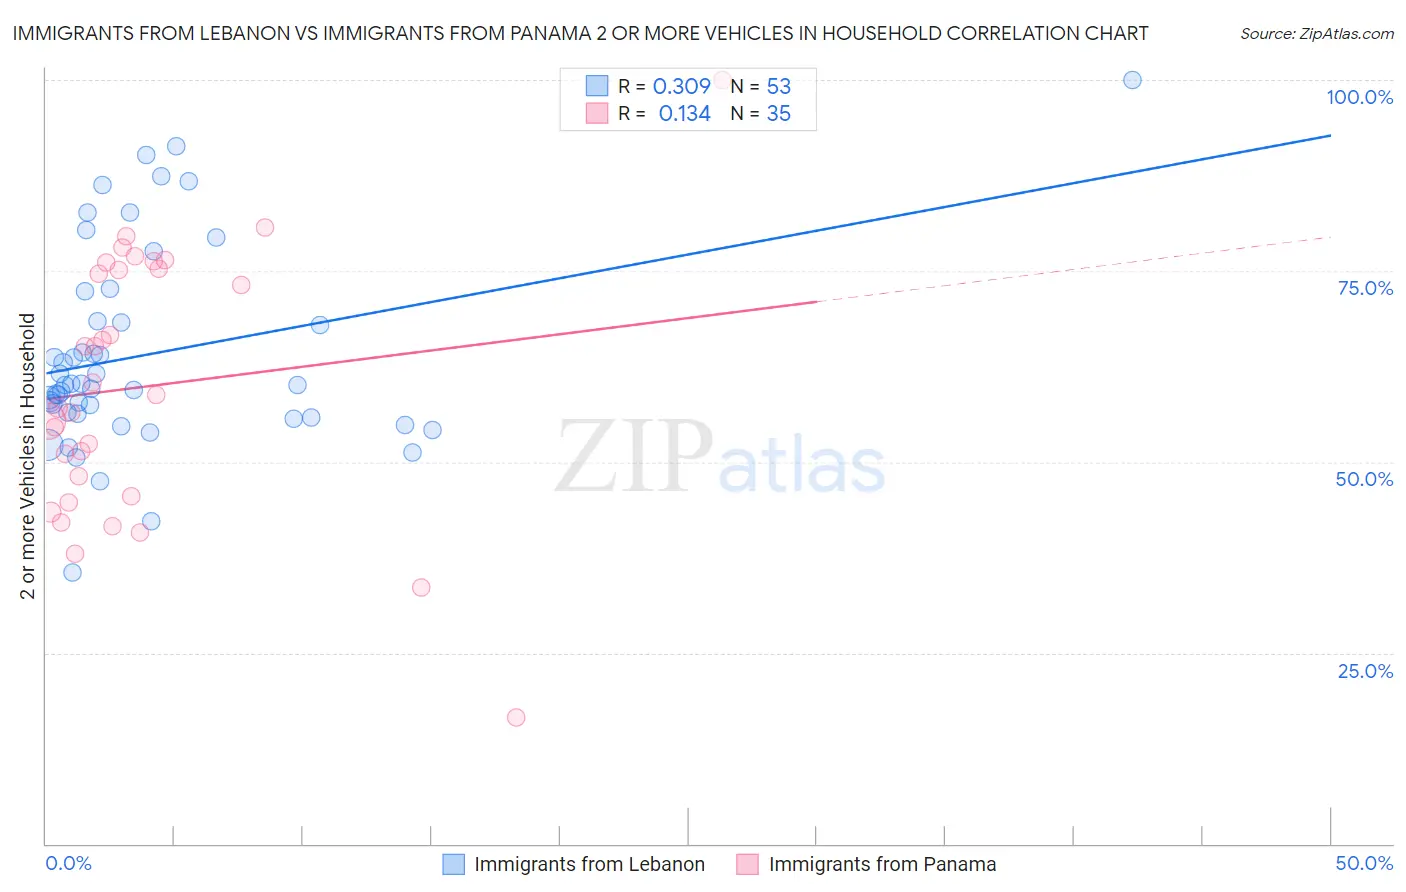
Immigrants from Lebanon vs Immigrants from Panama 2 or more Vehicles in Household Correlation Chart
The statistical analysis conducted on geographies consisting of 217,126,913 people shows a mild positive correlation between the proportion of Immigrants from Lebanon and percentage of households with 2 or more vehicles available in the United States with a correlation coefficient (R) of 0.309 and weighted average of 57.2%. Similarly, the statistical analysis conducted on geographies consisting of 221,156,465 people shows a poor positive correlation between the proportion of Immigrants from Panama and percentage of households with 2 or more vehicles available in the United States with a correlation coefficient (R) of 0.134 and weighted average of 51.1%, a difference of 12.1%.
2 or more Vehicles in Household Correlation Summary
| Measurement | Immigrants from Lebanon | Immigrants from Panama |
| Minimum | 35.5% | 16.5% |
| Maximum | 100.0% | 100.0% |
| Range | 64.5% | 83.5% |
| Mean | 64.1% | 59.9% |
| Median | 60.1% | 58.8% |
| Interquartile 25% (IQ1) | 56.0% | 45.5% |
| Interquartile 75% (IQ3) | 70.4% | 75.3% |
| Interquartile Range (IQR) | 14.3% | 29.8% |
| Standard Deviation (Sample) | 13.2% | 17.2% |
| Standard Deviation (Population) | 13.1% | 16.9% |
Similar Demographics by 2 or more Vehicles in Household
Demographics Similar to Immigrants from Lebanon by 2 or more Vehicles in Household
In terms of 2 or more vehicles in household, the demographic groups most similar to Immigrants from Lebanon are Zimbabwean (57.2%, a difference of 0.030%), Chippewa (57.2%, a difference of 0.050%), Immigrants from Jordan (57.2%, a difference of 0.070%), Iraqi (57.1%, a difference of 0.26%), and Asian (57.0%, a difference of 0.42%).
| Demographics | Rating | Rank | 2 or more Vehicles in Household |
| Immigrants | Netherlands | 98.2 /100 | #107 | Exceptional 57.5% |
| Immigrants | Canada | 98.1 /100 | #108 | Exceptional 57.5% |
| Immigrants | North America | 98.1 /100 | #109 | Exceptional 57.5% |
| Japanese | 98.0 /100 | #110 | Exceptional 57.5% |
| Greeks | 98.0 /100 | #111 | Exceptional 57.5% |
| Pueblo | 98.0 /100 | #112 | Exceptional 57.5% |
| Zimbabweans | 96.9 /100 | #113 | Exceptional 57.2% |
| Immigrants | Lebanon | 96.8 /100 | #114 | Exceptional 57.2% |
| Chippewa | 96.6 /100 | #115 | Exceptional 57.2% |
| Immigrants | Jordan | 96.6 /100 | #116 | Exceptional 57.2% |
| Iraqis | 95.8 /100 | #117 | Exceptional 57.1% |
| Asians | 95.1 /100 | #118 | Exceptional 57.0% |
| Natives/Alaskans | 95.0 /100 | #119 | Exceptional 57.0% |
| Costa Ricans | 94.7 /100 | #120 | Exceptional 56.9% |
| Sioux | 93.8 /100 | #121 | Exceptional 56.8% |
Demographics Similar to Immigrants from Panama by 2 or more Vehicles in Household
In terms of 2 or more vehicles in household, the demographic groups most similar to Immigrants from Panama are Belizean (51.0%, a difference of 0.030%), Somali (51.1%, a difference of 0.060%), Okinawan (51.2%, a difference of 0.35%), Immigrants from Ukraine (50.9%, a difference of 0.36%), and Black/African American (50.9%, a difference of 0.37%).
| Demographics | Rating | Rank | 2 or more Vehicles in Household |
| Immigrants | China | 0.1 /100 | #283 | Tragic 51.5% |
| Immigrants | Zaire | 0.1 /100 | #284 | Tragic 51.5% |
| Immigrants | Uruguay | 0.1 /100 | #285 | Tragic 51.4% |
| Immigrants | Liberia | 0.1 /100 | #286 | Tragic 51.3% |
| Immigrants | Serbia | 0.1 /100 | #287 | Tragic 51.3% |
| Okinawans | 0.1 /100 | #288 | Tragic 51.2% |
| Somalis | 0.0 /100 | #289 | Tragic 51.1% |
| Immigrants | Panama | 0.0 /100 | #290 | Tragic 51.1% |
| Belizeans | 0.0 /100 | #291 | Tragic 51.0% |
| Immigrants | Ukraine | 0.0 /100 | #292 | Tragic 50.9% |
| Blacks/African Americans | 0.0 /100 | #293 | Tragic 50.9% |
| Bermudans | 0.0 /100 | #294 | Tragic 50.6% |
| Cypriots | 0.0 /100 | #295 | Tragic 50.6% |
| Immigrants | Somalia | 0.0 /100 | #296 | Tragic 50.5% |
| Immigrants | Spain | 0.0 /100 | #297 | Tragic 50.4% |