Osage vs Immigrants from Panama 2 or more Vehicles in Household
COMPARE
Osage
Immigrants from Panama
2 or more Vehicles in Household
2 or more Vehicles in Household Comparison
Osage
Immigrants from Panama
58.8%
2 OR MORE VEHICLES IN HOUSEHOLD
99.8/ 100
METRIC RATING
61st/ 347
METRIC RANK
51.1%
2 OR MORE VEHICLES IN HOUSEHOLD
0.0/ 100
METRIC RATING
290th/ 347
METRIC RANK
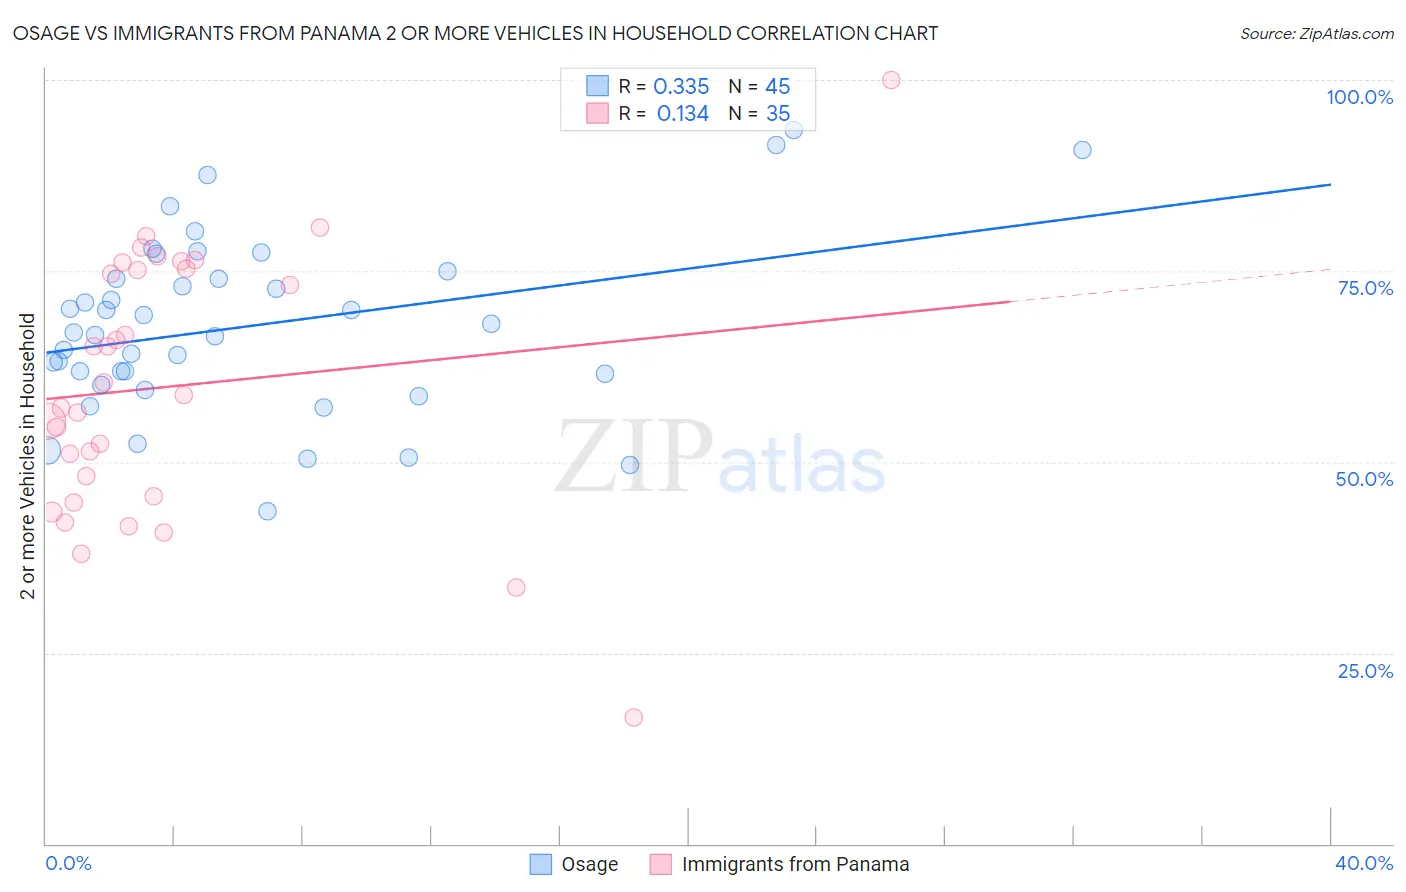
Osage vs Immigrants from Panama 2 or more Vehicles in Household Correlation Chart
The statistical analysis conducted on geographies consisting of 91,799,602 people shows a mild positive correlation between the proportion of Osage and percentage of households with 2 or more vehicles available in the United States with a correlation coefficient (R) of 0.335 and weighted average of 58.8%. Similarly, the statistical analysis conducted on geographies consisting of 221,156,465 people shows a poor positive correlation between the proportion of Immigrants from Panama and percentage of households with 2 or more vehicles available in the United States with a correlation coefficient (R) of 0.134 and weighted average of 51.1%, a difference of 15.1%.
2 or more Vehicles in Household Correlation Summary
| Measurement | Osage | Immigrants from Panama |
| Minimum | 43.5% | 16.5% |
| Maximum | 93.5% | 100.0% |
| Range | 50.0% | 83.5% |
| Mean | 67.8% | 59.9% |
| Median | 66.9% | 58.8% |
| Interquartile 25% (IQ1) | 60.8% | 45.5% |
| Interquartile 75% (IQ3) | 74.5% | 75.3% |
| Interquartile Range (IQR) | 13.7% | 29.8% |
| Standard Deviation (Sample) | 11.5% | 17.2% |
| Standard Deviation (Population) | 11.4% | 16.9% |
Similar Demographics by 2 or more Vehicles in Household
Demographics Similar to Osage by 2 or more Vehicles in Household
In terms of 2 or more vehicles in household, the demographic groups most similar to Osage are Nonimmigrants (58.8%, a difference of 0.040%), Mexican American Indian (58.7%, a difference of 0.11%), French Canadian (58.9%, a difference of 0.13%), Spanish American (58.9%, a difference of 0.16%), and Immigrants from Scotland (58.9%, a difference of 0.18%).
| Demographics | Rating | Rank | 2 or more Vehicles in Household |
| Bhutanese | 99.9 /100 | #54 | Exceptional 59.1% |
| Luxembourgers | 99.9 /100 | #55 | Exceptional 59.1% |
| Chickasaw | 99.9 /100 | #56 | Exceptional 59.0% |
| Afghans | 99.9 /100 | #57 | Exceptional 59.0% |
| Immigrants | Scotland | 99.8 /100 | #58 | Exceptional 58.9% |
| Spanish Americans | 99.8 /100 | #59 | Exceptional 58.9% |
| French Canadians | 99.8 /100 | #60 | Exceptional 58.9% |
| Osage | 99.8 /100 | #61 | Exceptional 58.8% |
| Immigrants | Nonimmigrants | 99.8 /100 | #62 | Exceptional 58.8% |
| Mexican American Indians | 99.8 /100 | #63 | Exceptional 58.7% |
| Portuguese | 99.7 /100 | #64 | Exceptional 58.6% |
| Immigrants | Central America | 99.7 /100 | #65 | Exceptional 58.6% |
| Croatians | 99.7 /100 | #66 | Exceptional 58.6% |
| Laotians | 99.7 /100 | #67 | Exceptional 58.6% |
| Canadians | 99.7 /100 | #68 | Exceptional 58.6% |
Demographics Similar to Immigrants from Panama by 2 or more Vehicles in Household
In terms of 2 or more vehicles in household, the demographic groups most similar to Immigrants from Panama are Belizean (51.0%, a difference of 0.030%), Somali (51.1%, a difference of 0.060%), Okinawan (51.2%, a difference of 0.35%), Immigrants from Ukraine (50.9%, a difference of 0.36%), and Black/African American (50.9%, a difference of 0.37%).
| Demographics | Rating | Rank | 2 or more Vehicles in Household |
| Immigrants | China | 0.1 /100 | #283 | Tragic 51.5% |
| Immigrants | Zaire | 0.1 /100 | #284 | Tragic 51.5% |
| Immigrants | Uruguay | 0.1 /100 | #285 | Tragic 51.4% |
| Immigrants | Liberia | 0.1 /100 | #286 | Tragic 51.3% |
| Immigrants | Serbia | 0.1 /100 | #287 | Tragic 51.3% |
| Okinawans | 0.1 /100 | #288 | Tragic 51.2% |
| Somalis | 0.0 /100 | #289 | Tragic 51.1% |
| Immigrants | Panama | 0.0 /100 | #290 | Tragic 51.1% |
| Belizeans | 0.0 /100 | #291 | Tragic 51.0% |
| Immigrants | Ukraine | 0.0 /100 | #292 | Tragic 50.9% |
| Blacks/African Americans | 0.0 /100 | #293 | Tragic 50.9% |
| Bermudans | 0.0 /100 | #294 | Tragic 50.6% |
| Cypriots | 0.0 /100 | #295 | Tragic 50.6% |
| Immigrants | Somalia | 0.0 /100 | #296 | Tragic 50.5% |
| Immigrants | Spain | 0.0 /100 | #297 | Tragic 50.4% |