Ghanaian vs Immigrants from Panama 2 or more Vehicles in Household
COMPARE
Ghanaian
Immigrants from Panama
2 or more Vehicles in Household
2 or more Vehicles in Household Comparison
Ghanaians
Immigrants from Panama
48.0%
2 OR MORE VEHICLES IN HOUSEHOLD
0.0/ 100
METRIC RATING
310th/ 347
METRIC RANK
51.1%
2 OR MORE VEHICLES IN HOUSEHOLD
0.0/ 100
METRIC RATING
290th/ 347
METRIC RANK
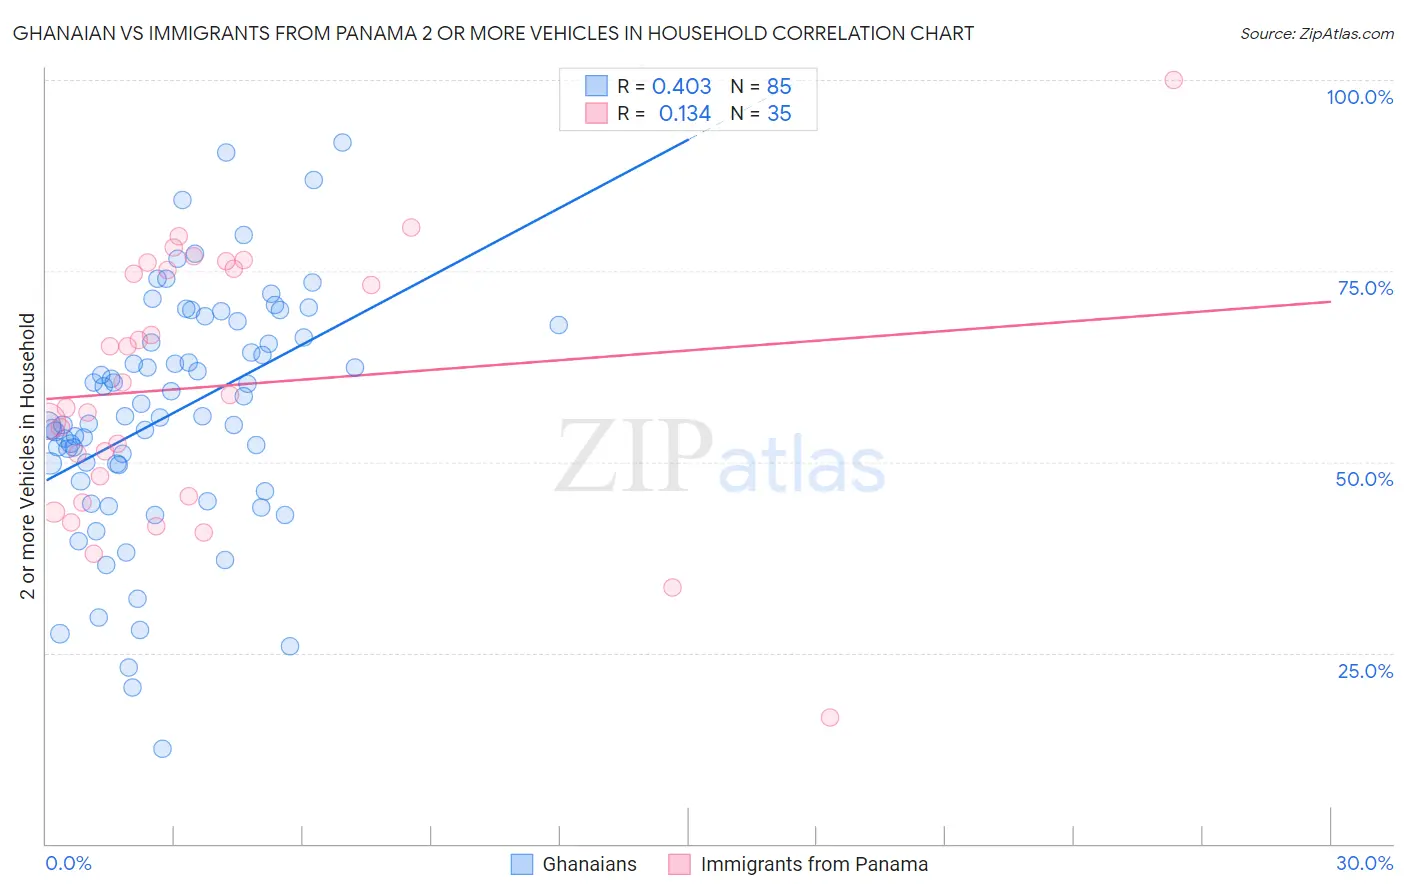
Ghanaian vs Immigrants from Panama 2 or more Vehicles in Household Correlation Chart
The statistical analysis conducted on geographies consisting of 190,548,121 people shows a moderate positive correlation between the proportion of Ghanaians and percentage of households with 2 or more vehicles available in the United States with a correlation coefficient (R) of 0.403 and weighted average of 48.0%. Similarly, the statistical analysis conducted on geographies consisting of 221,156,465 people shows a poor positive correlation between the proportion of Immigrants from Panama and percentage of households with 2 or more vehicles available in the United States with a correlation coefficient (R) of 0.134 and weighted average of 51.1%, a difference of 6.5%.
2 or more Vehicles in Household Correlation Summary
| Measurement | Ghanaian | Immigrants from Panama |
| Minimum | 12.4% | 16.5% |
| Maximum | 91.9% | 100.0% |
| Range | 79.5% | 83.5% |
| Mean | 56.3% | 59.9% |
| Median | 55.9% | 58.8% |
| Interquartile 25% (IQ1) | 48.5% | 45.5% |
| Interquartile 75% (IQ3) | 67.2% | 75.3% |
| Interquartile Range (IQR) | 18.7% | 29.8% |
| Standard Deviation (Sample) | 15.6% | 17.2% |
| Standard Deviation (Population) | 15.5% | 16.9% |
Demographics Similar to Ghanaians and Immigrants from Panama by 2 or more Vehicles in Household
In terms of 2 or more vehicles in household, the demographic groups most similar to Ghanaians are Moroccan (48.8%, a difference of 1.8%), Albanian (49.0%, a difference of 2.1%), Hopi (49.0%, a difference of 2.2%), Immigrants from Israel (49.2%, a difference of 2.6%), and Immigrants from Western Africa (49.4%, a difference of 2.9%). Similarly, the demographic groups most similar to Immigrants from Panama are Belizean (51.0%, a difference of 0.030%), Immigrants from Ukraine (50.9%, a difference of 0.36%), Black/African American (50.9%, a difference of 0.37%), Bermudan (50.6%, a difference of 0.93%), and Cypriot (50.6%, a difference of 1.0%).
| Demographics | Rating | Rank | 2 or more Vehicles in Household |
| Immigrants | Panama | 0.0 /100 | #290 | Tragic 51.1% |
| Belizeans | 0.0 /100 | #291 | Tragic 51.0% |
| Immigrants | Ukraine | 0.0 /100 | #292 | Tragic 50.9% |
| Blacks/African Americans | 0.0 /100 | #293 | Tragic 50.9% |
| Bermudans | 0.0 /100 | #294 | Tragic 50.6% |
| Cypriots | 0.0 /100 | #295 | Tragic 50.6% |
| Immigrants | Somalia | 0.0 /100 | #296 | Tragic 50.5% |
| Immigrants | Spain | 0.0 /100 | #297 | Tragic 50.4% |
| Paraguayans | 0.0 /100 | #298 | Tragic 50.3% |
| Immigrants | Morocco | 0.0 /100 | #299 | Tragic 50.3% |
| Immigrants | Russia | 0.0 /100 | #300 | Tragic 50.3% |
| Immigrants | Greece | 0.0 /100 | #301 | Tragic 50.2% |
| Immigrants | South America | 0.0 /100 | #302 | Tragic 50.2% |
| Tohono O'odham | 0.0 /100 | #303 | Tragic 50.0% |
| Immigrants | Belize | 0.0 /100 | #304 | Tragic 49.9% |
| Immigrants | Western Africa | 0.0 /100 | #305 | Tragic 49.4% |
| Immigrants | Israel | 0.0 /100 | #306 | Tragic 49.2% |
| Hopi | 0.0 /100 | #307 | Tragic 49.0% |
| Albanians | 0.0 /100 | #308 | Tragic 49.0% |
| Moroccans | 0.0 /100 | #309 | Tragic 48.8% |
| Ghanaians | 0.0 /100 | #310 | Tragic 48.0% |