Immigrants from Guyana vs Immigrants from Asia 3 or more Vehicles in Household

COMPARE

Immigrants from Guyana
Race
Ancestry
AfghanAfricanAlaska NativeAlaskan AthabascanAlbanianAleutAlsatianAmericanApacheArabArapahoArgentineanArmenianAssyrian/Chaldean/SyriacAustralianAustrianBahamianBangladeshiBarbadianBasqueBelgianBelizeanBermudanBhutaneseBlackfeetBolivianBrazilianBritishBritish West IndianBulgarianBurmeseCajunCambodianCanadianCape VerdeanCarpatho RusynCelticCentral AmericanCentral American IndianCherokeeCheyenneChickasawChileanChineseChippewaChoctawColombianColvilleComancheCosta RicanCreeCreekCroatianCrowCubanCypriotCzechCzechoslovakianDanishDelawareDominicanDutchDutch West IndianEastern EuropeanEcuadorianEgyptianEnglishEstonianEthiopianEuropeanFijianFilipinoFinnishFrenchFrench American IndianFrench CanadianGermanGerman RussianGhanaianGreekGuamanian/ChamorroGuatemalanGuyaneseHaitianHmongHonduranHopiHoumaHungarianIcelanderIndian (Asian)IndonesianInupiatIranianIraqiIrishIroquoisIsraeliItalianJamaicanJapaneseJordanianKenyanKiowaKoreanLaotianLatvianLebaneseLiberianLithuanianLumbeeLuxembourgerMacedonianMalaysianMalteseMarshalleseMenomineeMexicanMexican American IndianMongolianMoroccanNative HawaiianNavajoNepaleseNew ZealanderNicaraguanNigerianNorthern EuropeanNorwegianOkinawanOsageOttawaPaiutePakistaniPalestinianPanamanianParaguayanPennsylvania GermanPeruvianPimaPolishPortuguesePotawatomiPuebloPuerto RicanPuget Sound SalishRomanianRussianSalvadoranSamoanScandinavianScotch-IrishScottishSeminoleSenegaleseSerbianShoshoneSierra LeoneanSiouxSlavicSlovakSloveneSomaliSouth AfricanSouth AmericanSouth American IndianSoviet UnionSpaniardSpanishSpanish AmericanSpanish American IndianSri LankanSubsaharan AfricanSudaneseSwedishSwissSyrianTaiwaneseThaiTlingit-HaidaTohono O'OdhamTonganTrinidadian and TobagonianTsimshianTurkishU.S. Virgin IslanderUgandanUkrainianUruguayanUteVenezuelanVietnameseWelshWest IndianYakamaYaquiYugoslavianYumanYup'ikZimbabwean
Immigration
NonimmigrantsImmigrantsAfghanistanAfricaAlbaniaArgentinaArmeniaAustraliaAustriaBahamasBangladeshBarbadosBelarusBelgiumBelizeBoliviaBosnia and HerzegovinaBrazilBulgariaBurma/MyanmarCabo VerdeCambodiaCameroonCanadaCaribbeanCentral AmericaChileChinaColombiaCongoCosta RicaCroatiaCubaCzechoslovakiaDenmarkDominicaDominican RepublicEastern AfricaEastern AsiaEastern EuropeEcuadorEgyptEl SalvadorEnglandEritreaEthiopiaEuropeFijiFranceGermanyGhanaGreeceGrenadaGuatemalaGuyanaHaitiHondurasHong KongHungaryIndiaIndonesiaIranIraqIrelandIsraelItalyJamaicaJapanJordanKazakhstanKenyaKoreaKuwaitLaosLatin AmericaLatviaLebanonLiberiaLithuaniaMalaysiaMexicoMicronesiaMiddle AfricaMoldovaMoroccoNepalNetherlandsNicaraguaNigeriaNorth AmericaNorth MacedoniaNorthern AfricaNorthern EuropeNorwayOceaniaPakistanPanamaPeruPhilippinesPolandPortugalRomaniaRussiaSaudi ArabiaScotlandSenegalSerbiaSierra LeoneSingaporeSomaliaSouth AfricaSouth AmericaSouth Central AsiaSouth Eastern AsiaSouthern EuropeSpainSri LankaSt. Vincent and the GrenadinesSudanSwedenSwitzerlandSyriaTaiwanThailandTrinidad and TobagoTurkeyUgandaUkraineUruguayUzbekistanVenezuelaVietnamWest IndiesWestern AfricaWestern AsiaWestern EuropeYemenZaireZimbabweAzores
Immigrants from Asia
Race
Ancestry
AfghanAfricanAlaska NativeAlaskan AthabascanAlbanianAleutAlsatianAmericanApacheArabArapahoArgentineanArmenianAssyrian/Chaldean/SyriacAustralianAustrianBahamianBangladeshiBarbadianBasqueBelgianBelizeanBermudanBhutaneseBlackfeetBolivianBrazilianBritishBritish West IndianBulgarianBurmeseCajunCambodianCanadianCape VerdeanCarpatho RusynCelticCentral AmericanCentral American IndianCherokeeCheyenneChickasawChileanChineseChippewaChoctawColombianColvilleComancheCosta RicanCreeCreekCroatianCrowCubanCypriotCzechCzechoslovakianDanishDelawareDominicanDutchDutch West IndianEastern EuropeanEcuadorianEgyptianEnglishEstonianEthiopianEuropeanFijianFilipinoFinnishFrenchFrench American IndianFrench CanadianGermanGerman RussianGhanaianGreekGuamanian/ChamorroGuatemalanGuyaneseHaitianHmongHonduranHopiHoumaHungarianIcelanderIndian (Asian)IndonesianInupiatIranianIraqiIrishIroquoisIsraeliItalianJamaicanJapaneseJordanianKenyanKiowaKoreanLaotianLatvianLebaneseLiberianLithuanianLumbeeLuxembourgerMacedonianMalaysianMalteseMarshalleseMenomineeMexicanMexican American IndianMongolianMoroccanNative HawaiianNavajoNepaleseNew ZealanderNicaraguanNigerianNorthern EuropeanNorwegianOkinawanOsageOttawaPaiutePakistaniPalestinianPanamanianParaguayanPennsylvania GermanPeruvianPimaPolishPortuguesePotawatomiPuebloPuerto RicanPuget Sound SalishRomanianRussianSalvadoranSamoanScandinavianScotch-IrishScottishSeminoleSenegaleseSerbianShoshoneSierra LeoneanSiouxSlavicSlovakSloveneSomaliSouth AfricanSouth AmericanSouth American IndianSoviet UnionSpaniardSpanishSpanish AmericanSpanish American IndianSri LankanSubsaharan AfricanSudaneseSwedishSwissSyrianTaiwaneseThaiTlingit-HaidaTohono O'OdhamTonganTrinidadian and TobagonianTsimshianTurkishU.S. Virgin IslanderUgandanUkrainianUruguayanUteVenezuelanVietnameseWelshWest IndianYakamaYaquiYugoslavianYumanYup'ikZimbabwean
Immigration
NonimmigrantsImmigrantsAfghanistanAfricaAlbaniaArgentinaArmeniaAsiaAustraliaAustriaBahamasBangladeshBarbadosBelarusBelgiumBelizeBoliviaBosnia and HerzegovinaBrazilBulgariaBurma/MyanmarCabo VerdeCambodiaCameroonCanadaCaribbeanCentral AmericaChileChinaColombiaCongoCosta RicaCroatiaCubaCzechoslovakiaDenmarkDominicaDominican RepublicEastern AfricaEastern AsiaEastern EuropeEcuadorEgyptEl SalvadorEnglandEritreaEthiopiaEuropeFijiFranceGermanyGhanaGreeceGrenadaGuatemalaHaitiHondurasHong KongHungaryIndiaIndonesiaIranIraqIrelandIsraelItalyJamaicaJapanJordanKazakhstanKenyaKoreaKuwaitLaosLatin AmericaLatviaLebanonLiberiaLithuaniaMalaysiaMexicoMicronesiaMiddle AfricaMoldovaMoroccoNepalNetherlandsNicaraguaNigeriaNorth AmericaNorth MacedoniaNorthern AfricaNorthern EuropeNorwayOceaniaPakistanPanamaPeruPhilippinesPolandPortugalRomaniaRussiaSaudi ArabiaScotlandSenegalSerbiaSierra LeoneSingaporeSomaliaSouth AfricaSouth AmericaSouth Central AsiaSouth Eastern AsiaSouthern EuropeSpainSri LankaSt. Vincent and the GrenadinesSudanSwedenSwitzerlandSyriaTaiwanThailandTrinidad and TobagoTurkeyUgandaUkraineUruguayUzbekistanVenezuelaVietnamWest IndiesWestern AfricaWestern AsiaWestern EuropeYemenZaireZimbabweAzores
3 or more Vehicles in Household
Income
Poverty
Unemployment
Labor Participation
Family Structure
Vehicle Availability
Education Level
Disability

3 or more Vehicles in Household Comparison

Immigrants from Guyana

Immigrants from Asia

Tragic
Excellent
11.2%
3 OR MORE VEHICLES IN HOUSEHOLD
0.0/ 100
METRIC RATING
343rd/ 347
METRIC RANK
20.2%
3 OR MORE VEHICLES IN HOUSEHOLD
88.1/ 100
METRIC RATING
131st/ 347
METRIC RANK

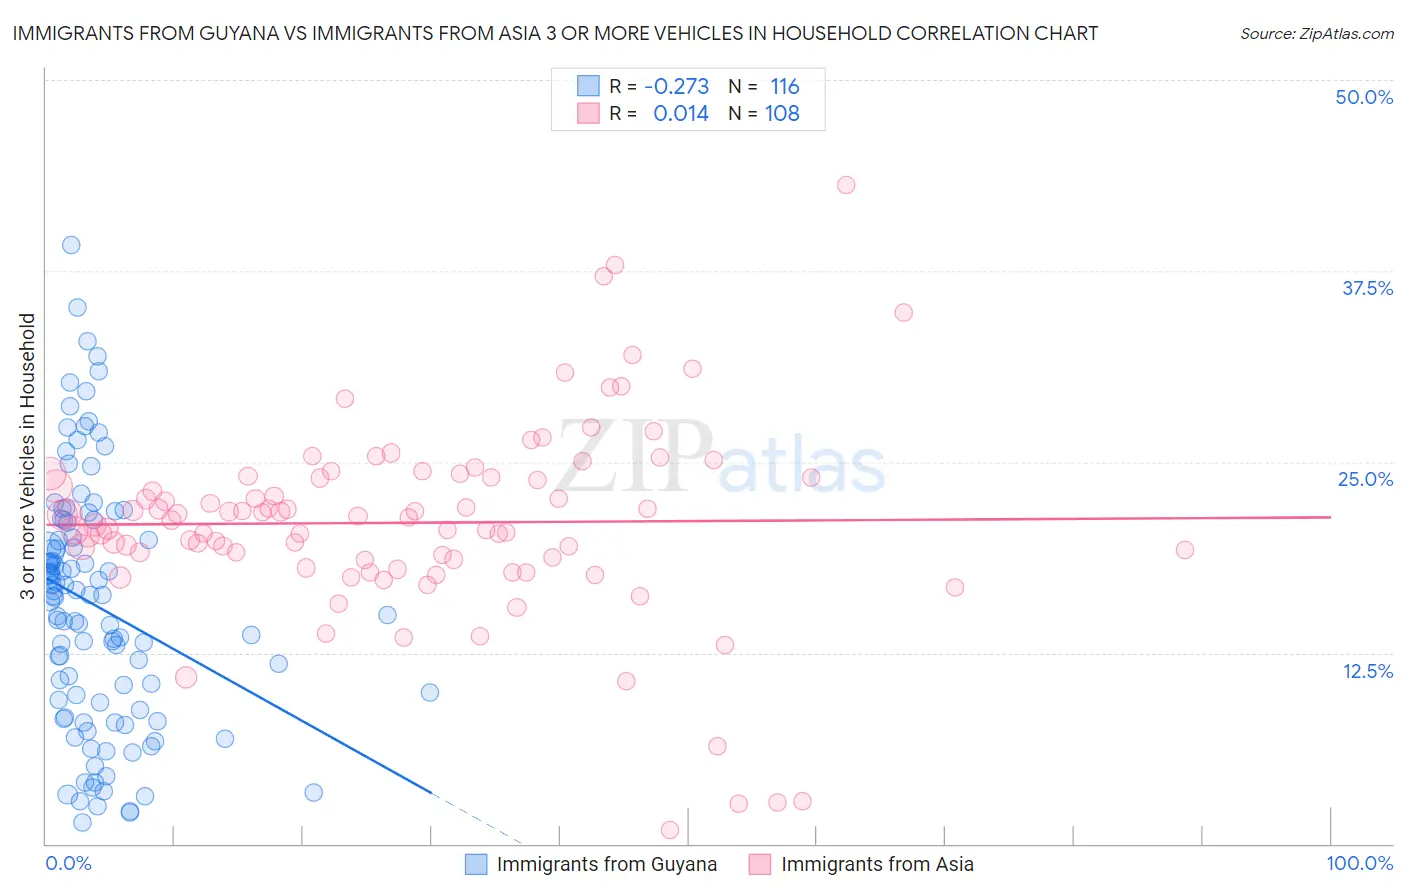
Immigrants from Guyana vs Immigrants from Asia 3 or more Vehicles in Household Correlation Chart

The statistical analysis conducted on geographies consisting of 183,650,953 people shows a weak negative correlation between the proportion of Immigrants from Guyana and percentage of households with 3 or more vehicles available in the United States with a correlation coefficient (R) of -0.273 and weighted average of 11.2%. Similarly, the statistical analysis conducted on geographies consisting of 548,260,501 people shows no correlation between the proportion of Immigrants from Asia and percentage of households with 3 or more vehicles available in the United States with a correlation coefficient (R) of 0.014 and weighted average of 20.2%, a difference of 80.0%.
Immigrants from Guyana vs Immigrants from Asia 3 or more Vehicles in Household

3 or more Vehicles in Household Correlation Summary

MeasurementImmigrants from GuyanaImmigrants from Asia
Minimum1.4%0.88%
Maximum39.2%43.1%
Range37.8%42.3%
Mean15.5%21.0%
Median16.2%21.3%
Interquartile 25% (IQ1)9.0%18.6%
Interquartile 75% (IQ3)20.5%24.0%
Interquartile Range (IQR)11.5%5.4%
Standard Deviation (Sample)8.1%6.5%
Standard Deviation (Population)8.1%6.4%

Similar Demographics by 3 or more Vehicles in Household

Demographics Similar to Immigrants from Guyana by 3 or more Vehicles in Household

In terms of 3 or more vehicles in household, the demographic groups most similar to Immigrants from Guyana are Dominican (11.2%, a difference of 0.15%), British West Indian (11.4%, a difference of 1.8%), Guyanese (11.5%, a difference of 1.9%), Immigrants from Barbados (11.7%, a difference of 4.3%), and Immigrants from Uzbekistan (12.0%, a difference of 6.6%).
DemographicsRating | Rank3 or more Vehicles in Household
Immigrants | Cabo Verde
0.0
/100
|
#333
Tragic
13.6%
Immigrants | Ecuador
0.0
/100
|
#334
Tragic
13.4%
Immigrants | Trinidad and Tobago
0.0
/100
|
#335
Tragic
13.3%
Barbadians
0.0
/100
|
#336
Tragic
12.6%
Immigrants | Bangladesh
0.0
/100
|
#337
Tragic
12.5%
Vietnamese
0.0
/100
|
#338
Tragic
12.5%
Immigrants | Uzbekistan
0.0
/100
|
#339
Tragic
12.0%
Immigrants | Barbados
0.0
/100
|
#340
Tragic
11.7%
Guyanese
0.0
/100
|
#341
Tragic
11.5%
British West Indians
0.0
/100
|
#342
Tragic
11.4%
Immigrants | Guyana
0.0
/100
|
#343
Tragic
11.2%
Dominicans
0.0
/100
|
#344
Tragic
11.2%
Immigrants | Dominican Republic
0.0
/100
|
#345
Tragic
10.4%
Immigrants | St. Vincent and the Grenadines
0.0
/100
|
#346
Tragic
10.1%
Immigrants | Grenada
0.0
/100
|
#347
Tragic
9.1%

Demographics Similar to Immigrants from Asia by 3 or more Vehicles in Household

In terms of 3 or more vehicles in household, the demographic groups most similar to Immigrants from Asia are Immigrants from Canada (20.2%, a difference of 0.050%), Immigrants from North America (20.2%, a difference of 0.050%), Greek (20.3%, a difference of 0.070%), Zimbabwean (20.3%, a difference of 0.10%), and Polish (20.2%, a difference of 0.14%).
DemographicsRating | Rank3 or more Vehicles in Household
Central Americans
93.1
/100
|
#124
Exceptional
20.5%
Immigrants | Netherlands
92.9
/100
|
#125
Exceptional
20.4%
Slavs
92.1
/100
|
#126
Exceptional
20.4%
Immigrants | Bolivia
92.0
/100
|
#127
Exceptional
20.4%
New Zealanders
91.3
/100
|
#128
Exceptional
20.4%
Zimbabweans
88.7
/100
|
#129
Excellent
20.3%
Greeks
88.6
/100
|
#130
Excellent
20.3%
Immigrants | Asia
88.1
/100
|
#131
Excellent
20.2%
Immigrants | Canada
87.8
/100
|
#132
Excellent
20.2%
Immigrants | North America
87.8
/100
|
#133
Excellent
20.2%
Poles
87.3
/100
|
#134
Excellent
20.2%
Immigrants | India
87.2
/100
|
#135
Excellent
20.2%
Immigrants | Nicaragua
87.1
/100
|
#136
Excellent
20.2%
Immigrants | Iraq
87.1
/100
|
#137
Excellent
20.2%
Aleuts
86.3
/100
|
#138
Excellent
20.2%