Scottish vs Immigrants from Scotland Bachelor's Degree
COMPARE
Scottish
Immigrants from Scotland
Bachelor's Degree
Bachelor's Degree Comparison
Scottish
Immigrants from Scotland
38.1%
BACHELOR'S DEGREE
56.6/ 100
METRIC RATING
167th/ 347
METRIC RANK
42.3%
BACHELOR'S DEGREE
99.2/ 100
METRIC RATING
82nd/ 347
METRIC RANK
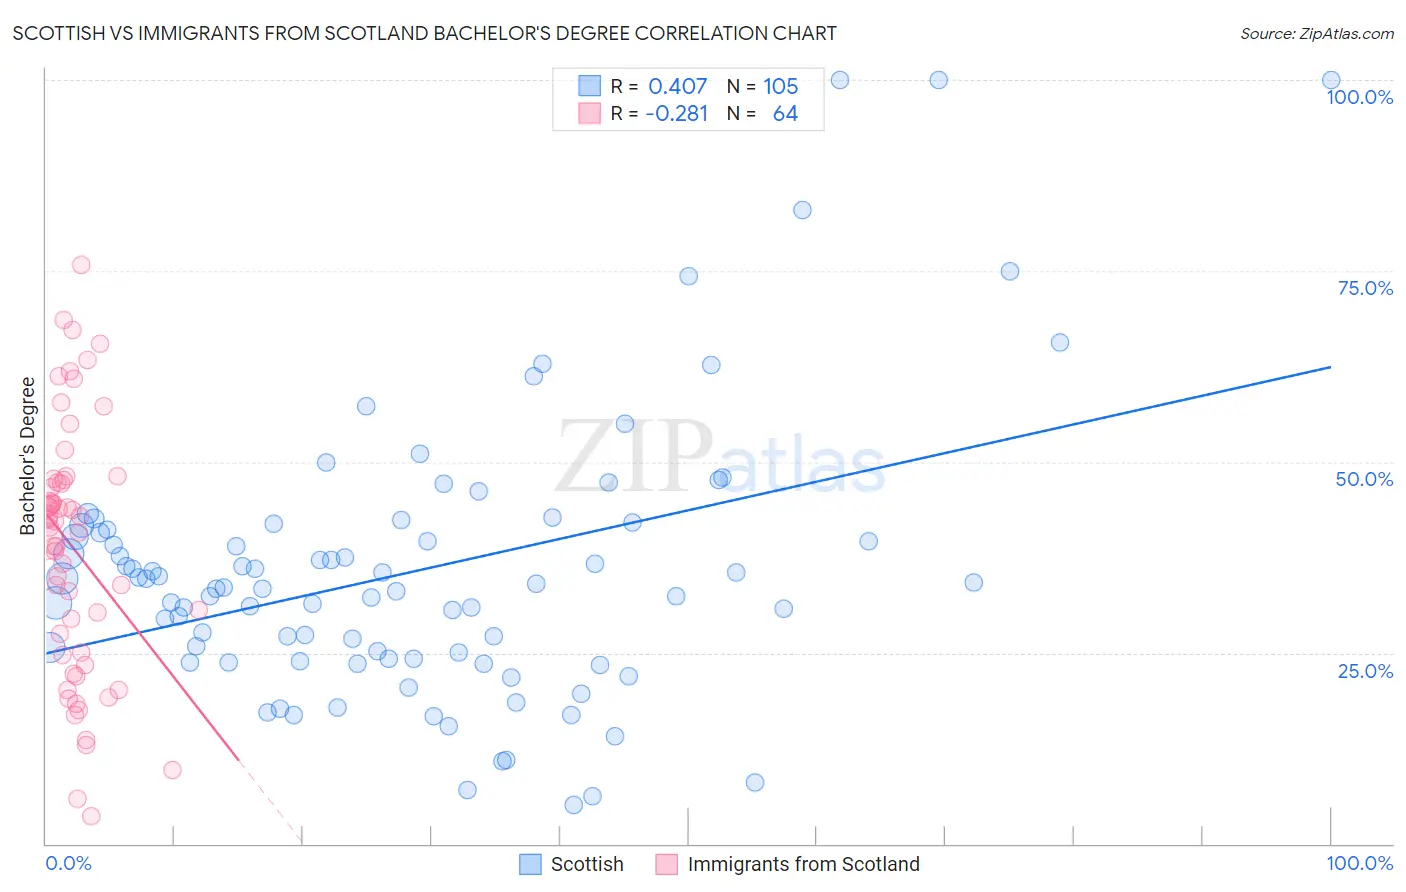
Scottish vs Immigrants from Scotland Bachelor's Degree Correlation Chart
The statistical analysis conducted on geographies consisting of 567,001,084 people shows a moderate positive correlation between the proportion of Scottish and percentage of population with at least bachelor's degree education in the United States with a correlation coefficient (R) of 0.407 and weighted average of 38.1%. Similarly, the statistical analysis conducted on geographies consisting of 196,394,351 people shows a weak negative correlation between the proportion of Immigrants from Scotland and percentage of population with at least bachelor's degree education in the United States with a correlation coefficient (R) of -0.281 and weighted average of 42.3%, a difference of 11.1%.
Bachelor's Degree Correlation Summary
| Measurement | Scottish | Immigrants from Scotland |
| Minimum | 5.1% | 3.5% |
| Maximum | 100.0% | 75.8% |
| Range | 94.9% | 72.3% |
| Mean | 35.6% | 38.6% |
| Median | 33.5% | 41.8% |
| Interquartile 25% (IQ1) | 24.2% | 24.9% |
| Interquartile 75% (IQ3) | 41.4% | 47.5% |
| Interquartile Range (IQR) | 17.2% | 22.6% |
| Standard Deviation (Sample) | 18.1% | 16.4% |
| Standard Deviation (Population) | 18.0% | 16.2% |
Similar Demographics by Bachelor's Degree
Demographics Similar to Scottish by Bachelor's Degree
In terms of bachelor's degree, the demographic groups most similar to Scottish are Danish (38.1%, a difference of 0.030%), Ghanaian (38.0%, a difference of 0.12%), Somali (38.1%, a difference of 0.21%), Czech (38.0%, a difference of 0.22%), and Bermudan (38.0%, a difference of 0.23%).
| Demographics | Rating | Rank | Bachelor's Degree |
| Vietnamese | 66.6 /100 | #160 | Good 38.5% |
| Uruguayans | 65.8 /100 | #161 | Good 38.4% |
| Colombians | 65.0 /100 | #162 | Good 38.4% |
| Peruvians | 63.4 /100 | #163 | Good 38.3% |
| Hungarians | 62.1 /100 | #164 | Good 38.3% |
| Sri Lankans | 59.1 /100 | #165 | Average 38.2% |
| Somalis | 58.6 /100 | #166 | Average 38.1% |
| Scottish | 56.6 /100 | #167 | Average 38.1% |
| Danes | 56.2 /100 | #168 | Average 38.1% |
| Ghanaians | 55.3 /100 | #169 | Average 38.0% |
| Czechs | 54.4 /100 | #170 | Average 38.0% |
| Bermudans | 54.2 /100 | #171 | Average 38.0% |
| Immigrants | Somalia | 52.8 /100 | #172 | Average 37.9% |
| Immigrants | Iraq | 52.5 /100 | #173 | Average 37.9% |
| Immigrants | Bangladesh | 50.0 /100 | #174 | Average 37.8% |
Demographics Similar to Immigrants from Scotland by Bachelor's Degree
In terms of bachelor's degree, the demographic groups most similar to Immigrants from Scotland are Armenian (42.3%, a difference of 0.030%), Immigrants from Western Asia (42.3%, a difference of 0.050%), Immigrants from Hungary (42.3%, a difference of 0.070%), Lithuanian (42.2%, a difference of 0.070%), and Immigrants from Croatia (42.3%, a difference of 0.080%).
| Demographics | Rating | Rank | Bachelor's Degree |
| Immigrants | Zimbabwe | 99.4 /100 | #75 | Exceptional 42.6% |
| Immigrants | Egypt | 99.4 /100 | #76 | Exceptional 42.6% |
| Immigrants | Eastern Europe | 99.4 /100 | #77 | Exceptional 42.5% |
| Immigrants | Ethiopia | 99.4 /100 | #78 | Exceptional 42.5% |
| Immigrants | Lebanon | 99.3 /100 | #79 | Exceptional 42.4% |
| Immigrants | Croatia | 99.2 /100 | #80 | Exceptional 42.3% |
| Immigrants | Hungary | 99.2 /100 | #81 | Exceptional 42.3% |
| Immigrants | Scotland | 99.2 /100 | #82 | Exceptional 42.3% |
| Armenians | 99.2 /100 | #83 | Exceptional 42.3% |
| Immigrants | Western Asia | 99.2 /100 | #84 | Exceptional 42.3% |
| Lithuanians | 99.2 /100 | #85 | Exceptional 42.2% |
| Immigrants | Brazil | 99.2 /100 | #86 | Exceptional 42.2% |
| Carpatho Rusyns | 99.0 /100 | #87 | Exceptional 42.1% |
| Immigrants | Western Europe | 99.0 /100 | #88 | Exceptional 42.0% |
| Greeks | 99.0 /100 | #89 | Exceptional 42.0% |