Scottish vs Immigrants from Scotland Vision Disability
COMPARE
Scottish
Immigrants from Scotland
Vision Disability
Vision Disability Comparison
Scottish
Immigrants from Scotland
2.3%
VISION DISABILITY
1.6/ 100
METRIC RATING
234th/ 347
METRIC RANK
2.1%
VISION DISABILITY
90.4/ 100
METRIC RATING
121st/ 347
METRIC RANK
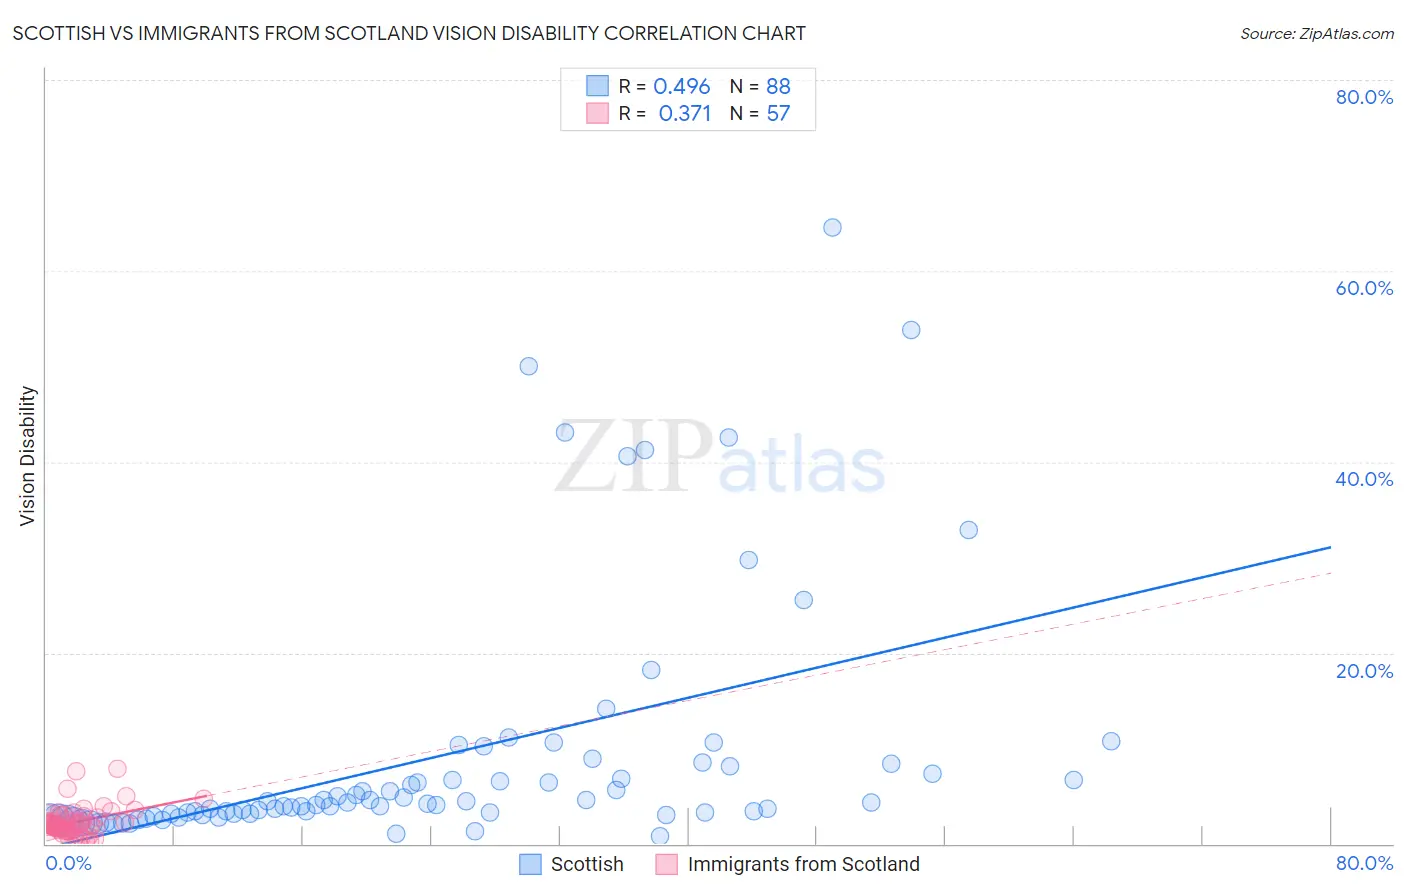
Scottish vs Immigrants from Scotland Vision Disability Correlation Chart
The statistical analysis conducted on geographies consisting of 565,142,315 people shows a moderate positive correlation between the proportion of Scottish and percentage of population with vision disability in the United States with a correlation coefficient (R) of 0.496 and weighted average of 2.3%. Similarly, the statistical analysis conducted on geographies consisting of 196,324,297 people shows a mild positive correlation between the proportion of Immigrants from Scotland and percentage of population with vision disability in the United States with a correlation coefficient (R) of 0.371 and weighted average of 2.1%, a difference of 10.4%.
Vision Disability Correlation Summary
| Measurement | Scottish | Immigrants from Scotland |
| Minimum | 0.83% | 0.21% |
| Maximum | 64.6% | 7.9% |
| Range | 63.8% | 7.7% |
| Mean | 9.1% | 2.3% |
| Median | 4.1% | 2.0% |
| Interquartile 25% (IQ1) | 3.0% | 1.4% |
| Interquartile 75% (IQ3) | 7.7% | 2.8% |
| Interquartile Range (IQR) | 4.7% | 1.4% |
| Standard Deviation (Sample) | 12.9% | 1.5% |
| Standard Deviation (Population) | 12.8% | 1.5% |
Similar Demographics by Vision Disability
Demographics Similar to Scottish by Vision Disability
In terms of vision disability, the demographic groups most similar to Scottish are Marshallese (2.3%, a difference of 0.070%), Immigrants from Congo (2.3%, a difference of 0.16%), Central American (2.3%, a difference of 0.18%), German Russian (2.3%, a difference of 0.20%), and Immigrants from Portugal (2.3%, a difference of 0.21%).
| Demographics | Rating | Rank | Vision Disability |
| Hawaiians | 2.9 /100 | #227 | Tragic 2.3% |
| Hmong | 2.5 /100 | #228 | Tragic 2.3% |
| Welsh | 2.3 /100 | #229 | Tragic 2.3% |
| Nicaraguans | 2.2 /100 | #230 | Tragic 2.3% |
| Immigrants | Ecuador | 2.0 /100 | #231 | Tragic 2.3% |
| German Russians | 1.8 /100 | #232 | Tragic 2.3% |
| Central Americans | 1.8 /100 | #233 | Tragic 2.3% |
| Scottish | 1.6 /100 | #234 | Tragic 2.3% |
| Marshallese | 1.5 /100 | #235 | Tragic 2.3% |
| Immigrants | Congo | 1.4 /100 | #236 | Tragic 2.3% |
| Immigrants | Portugal | 1.4 /100 | #237 | Tragic 2.3% |
| Immigrants | Cambodia | 1.1 /100 | #238 | Tragic 2.3% |
| English | 1.1 /100 | #239 | Tragic 2.3% |
| Panamanians | 0.9 /100 | #240 | Tragic 2.3% |
| Malaysians | 0.9 /100 | #241 | Tragic 2.3% |
Demographics Similar to Immigrants from Scotland by Vision Disability
In terms of vision disability, the demographic groups most similar to Immigrants from Scotland are Immigrants from Ukraine (2.1%, a difference of 0.010%), Immigrants from Albania (2.1%, a difference of 0.010%), Immigrants from Spain (2.1%, a difference of 0.11%), Immigrants from Zimbabwe (2.1%, a difference of 0.12%), and Immigrants from Venezuela (2.1%, a difference of 0.12%).
| Demographics | Rating | Rank | Vision Disability |
| Croatians | 92.3 /100 | #114 | Exceptional 2.1% |
| Immigrants | Vietnam | 92.2 /100 | #115 | Exceptional 2.1% |
| Ugandans | 92.2 /100 | #116 | Exceptional 2.1% |
| Poles | 92.0 /100 | #117 | Exceptional 2.1% |
| Immigrants | Philippines | 91.4 /100 | #118 | Exceptional 2.1% |
| Immigrants | Uganda | 91.4 /100 | #119 | Exceptional 2.1% |
| Immigrants | Zimbabwe | 91.0 /100 | #120 | Exceptional 2.1% |
| Immigrants | Scotland | 90.4 /100 | #121 | Exceptional 2.1% |
| Immigrants | Ukraine | 90.4 /100 | #122 | Exceptional 2.1% |
| Immigrants | Albania | 90.4 /100 | #123 | Exceptional 2.1% |
| Immigrants | Spain | 89.8 /100 | #124 | Excellent 2.1% |
| Immigrants | Venezuela | 89.8 /100 | #125 | Excellent 2.1% |
| Immigrants | Peru | 89.5 /100 | #126 | Excellent 2.1% |
| Sudanese | 89.2 /100 | #127 | Excellent 2.1% |
| Immigrants | Chile | 89.0 /100 | #128 | Excellent 2.1% |