Scottish vs Immigrants from Bolivia 3 or more Vehicles in Household
COMPARE
Scottish
Immigrants from Bolivia
3 or more Vehicles in Household
3 or more Vehicles in Household Comparison
Scottish
Immigrants from Bolivia
22.6%
3 OR MORE VEHICLES IN HOUSEHOLD
100.0/ 100
METRIC RATING
48th/ 347
METRIC RANK
20.4%
3 OR MORE VEHICLES IN HOUSEHOLD
92.0/ 100
METRIC RATING
127th/ 347
METRIC RANK
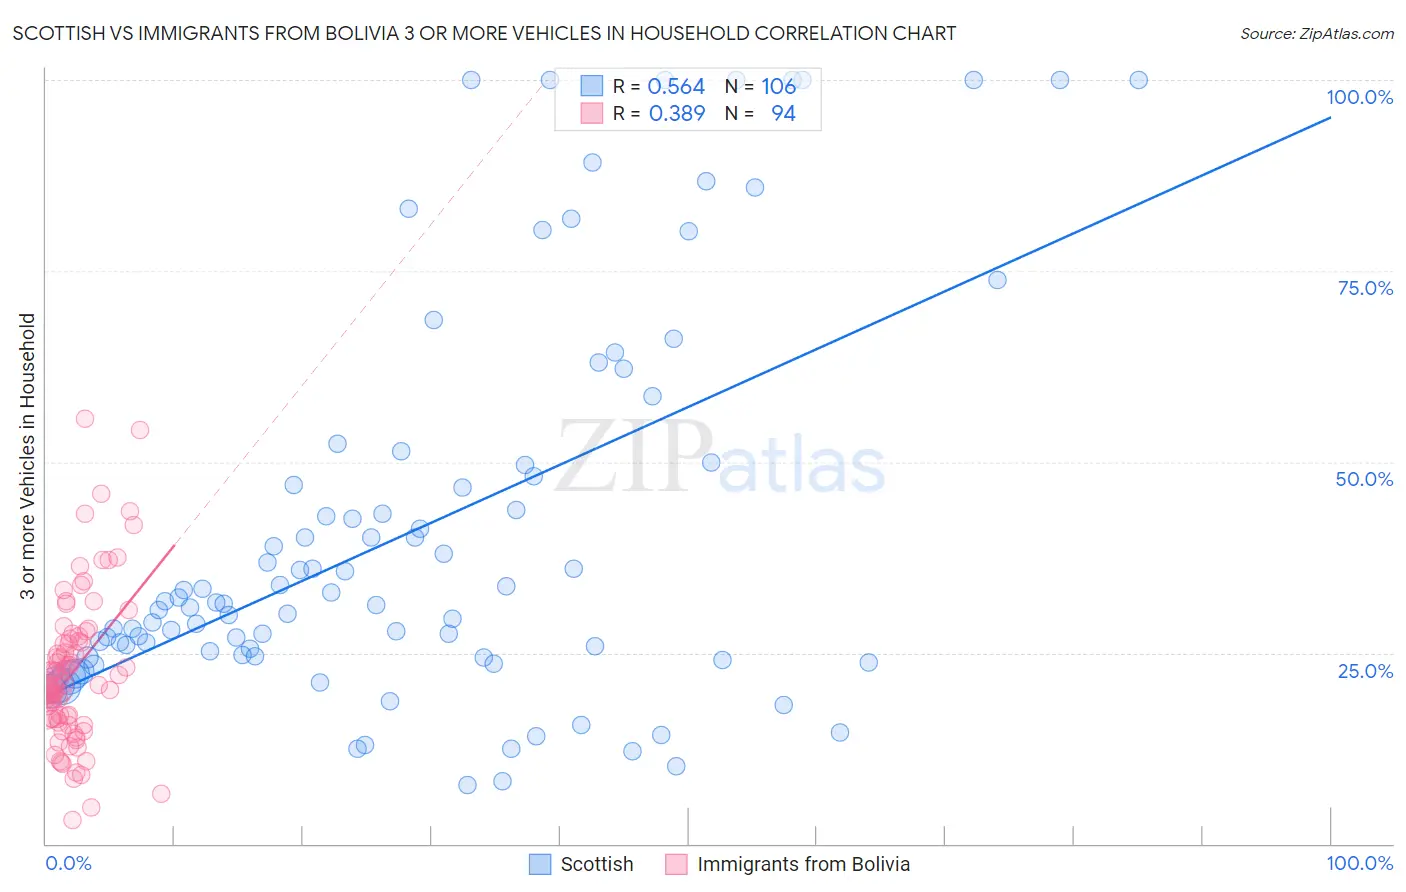
Scottish vs Immigrants from Bolivia 3 or more Vehicles in Household Correlation Chart
The statistical analysis conducted on geographies consisting of 566,280,219 people shows a substantial positive correlation between the proportion of Scottish and percentage of households with 3 or more vehicles available in the United States with a correlation coefficient (R) of 0.564 and weighted average of 22.6%. Similarly, the statistical analysis conducted on geographies consisting of 158,700,588 people shows a mild positive correlation between the proportion of Immigrants from Bolivia and percentage of households with 3 or more vehicles available in the United States with a correlation coefficient (R) of 0.389 and weighted average of 20.4%, a difference of 10.9%.
3 or more Vehicles in Household Correlation Summary
| Measurement | Scottish | Immigrants from Bolivia |
| Minimum | 7.6% | 3.1% |
| Maximum | 100.0% | 55.7% |
| Range | 92.4% | 52.6% |
| Mean | 41.1% | 22.5% |
| Median | 31.5% | 20.9% |
| Interquartile 25% (IQ1) | 24.5% | 16.3% |
| Interquartile 75% (IQ3) | 49.6% | 26.5% |
| Interquartile Range (IQR) | 25.1% | 10.2% |
| Standard Deviation (Sample) | 25.7% | 9.8% |
| Standard Deviation (Population) | 25.6% | 9.8% |
Similar Demographics by 3 or more Vehicles in Household
Demographics Similar to Scottish by 3 or more Vehicles in Household
In terms of 3 or more vehicles in household, the demographic groups most similar to Scottish are Malaysian (22.6%, a difference of 0.010%), American (22.6%, a difference of 0.020%), Scotch-Irish (22.6%, a difference of 0.10%), Sioux (22.6%, a difference of 0.16%), and White/Caucasian (22.6%, a difference of 0.17%).
| Demographics | Rating | Rank | 3 or more Vehicles in Household |
| Germans | 100.0 /100 | #41 | Exceptional 22.7% |
| Natives/Alaskans | 100.0 /100 | #42 | Exceptional 22.7% |
| Osage | 100.0 /100 | #43 | Exceptional 22.7% |
| Cheyenne | 100.0 /100 | #44 | Exceptional 22.7% |
| Ute | 100.0 /100 | #45 | Exceptional 22.7% |
| Americans | 100.0 /100 | #46 | Exceptional 22.6% |
| Malaysians | 100.0 /100 | #47 | Exceptional 22.6% |
| Scottish | 100.0 /100 | #48 | Exceptional 22.6% |
| Scotch-Irish | 100.0 /100 | #49 | Exceptional 22.6% |
| Sioux | 100.0 /100 | #50 | Exceptional 22.6% |
| Whites/Caucasians | 100.0 /100 | #51 | Exceptional 22.6% |
| Welsh | 100.0 /100 | #52 | Exceptional 22.6% |
| Czechs | 100.0 /100 | #53 | Exceptional 22.5% |
| Crow | 100.0 /100 | #54 | Exceptional 22.5% |
| Immigrants | Laos | 100.0 /100 | #55 | Exceptional 22.4% |
Demographics Similar to Immigrants from Bolivia by 3 or more Vehicles in Household
In terms of 3 or more vehicles in household, the demographic groups most similar to Immigrants from Bolivia are Slavic (20.4%, a difference of 0.030%), New Zealander (20.4%, a difference of 0.17%), Immigrants from Netherlands (20.4%, a difference of 0.25%), Central American (20.5%, a difference of 0.28%), and Immigrants from Korea (20.5%, a difference of 0.45%).
| Demographics | Rating | Rank | 3 or more Vehicles in Household |
| Maltese | 93.9 /100 | #120 | Exceptional 20.5% |
| Immigrants | Thailand | 93.8 /100 | #121 | Exceptional 20.5% |
| German Russians | 93.7 /100 | #122 | Exceptional 20.5% |
| Immigrants | Korea | 93.7 /100 | #123 | Exceptional 20.5% |
| Central Americans | 93.1 /100 | #124 | Exceptional 20.5% |
| Immigrants | Netherlands | 92.9 /100 | #125 | Exceptional 20.4% |
| Slavs | 92.1 /100 | #126 | Exceptional 20.4% |
| Immigrants | Bolivia | 92.0 /100 | #127 | Exceptional 20.4% |
| New Zealanders | 91.3 /100 | #128 | Exceptional 20.4% |
| Zimbabweans | 88.7 /100 | #129 | Excellent 20.3% |
| Greeks | 88.6 /100 | #130 | Excellent 20.3% |
| Immigrants | Asia | 88.1 /100 | #131 | Excellent 20.2% |
| Immigrants | Canada | 87.8 /100 | #132 | Excellent 20.2% |
| Immigrants | North America | 87.8 /100 | #133 | Excellent 20.2% |
| Poles | 87.3 /100 | #134 | Excellent 20.2% |