Scandinavian vs Immigrants from France 2 or more Vehicles in Household
COMPARE
Scandinavian
Immigrants from France
2 or more Vehicles in Household
2 or more Vehicles in Household Comparison
Scandinavians
Immigrants from France
62.1%
2 OR MORE VEHICLES IN HOUSEHOLD
100.0/ 100
METRIC RATING
6th/ 347
METRIC RANK
52.0%
2 OR MORE VEHICLES IN HOUSEHOLD
0.2/ 100
METRIC RATING
266th/ 347
METRIC RANK
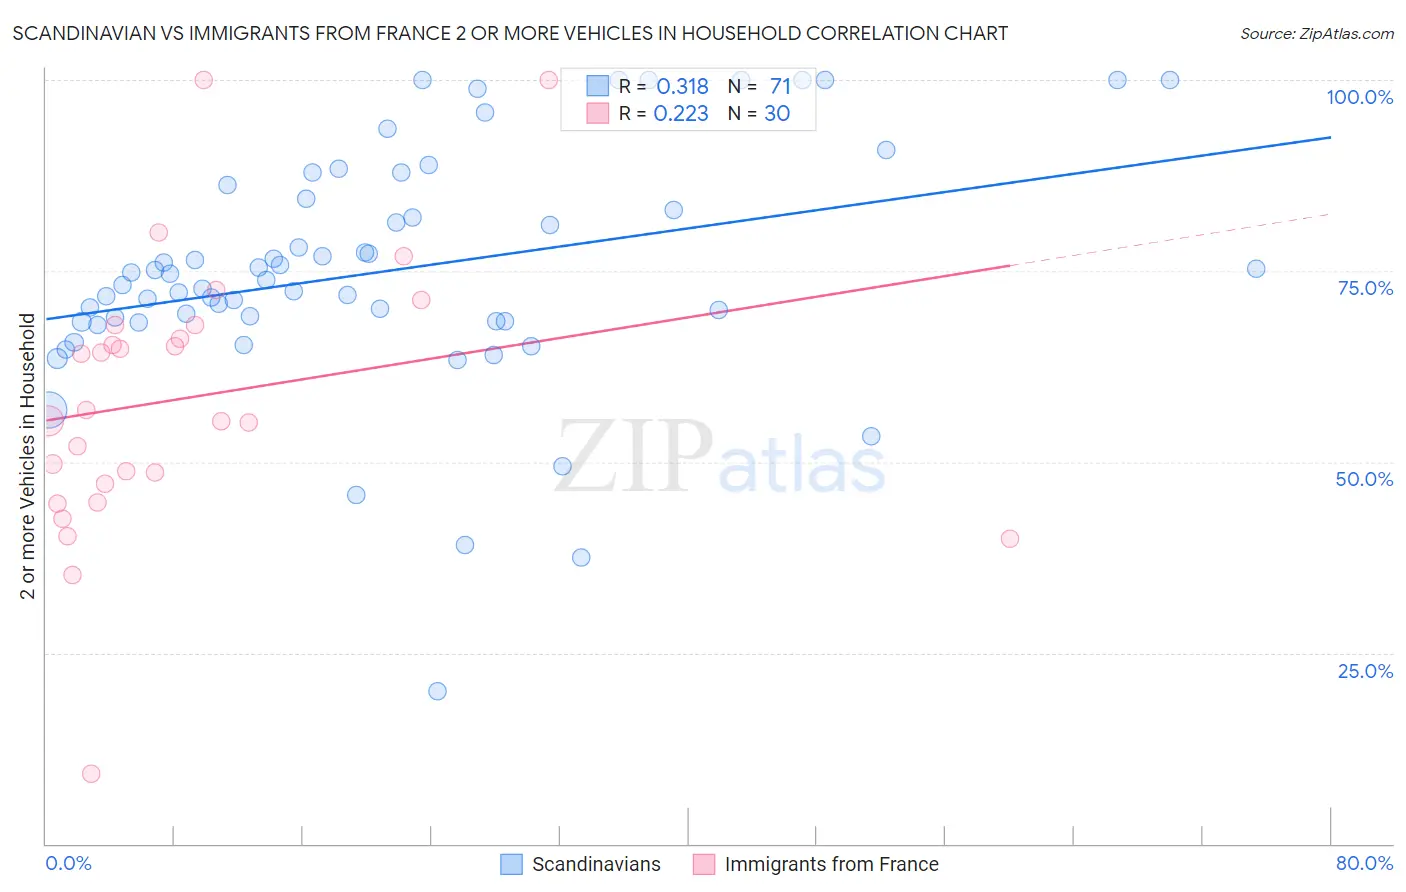
Scandinavian vs Immigrants from France 2 or more Vehicles in Household Correlation Chart
The statistical analysis conducted on geographies consisting of 472,330,499 people shows a mild positive correlation between the proportion of Scandinavians and percentage of households with 2 or more vehicles available in the United States with a correlation coefficient (R) of 0.318 and weighted average of 62.1%. Similarly, the statistical analysis conducted on geographies consisting of 287,851,745 people shows a weak positive correlation between the proportion of Immigrants from France and percentage of households with 2 or more vehicles available in the United States with a correlation coefficient (R) of 0.223 and weighted average of 52.0%, a difference of 19.3%.
2 or more Vehicles in Household Correlation Summary
| Measurement | Scandinavian | Immigrants from France |
| Minimum | 20.0% | 9.2% |
| Maximum | 100.0% | 100.0% |
| Range | 80.0% | 90.8% |
| Mean | 75.0% | 58.4% |
| Median | 73.9% | 56.1% |
| Interquartile 25% (IQ1) | 68.4% | 47.1% |
| Interquartile 75% (IQ3) | 84.4% | 68.0% |
| Interquartile Range (IQR) | 16.0% | 20.9% |
| Standard Deviation (Sample) | 15.6% | 18.4% |
| Standard Deviation (Population) | 15.5% | 18.1% |
Similar Demographics by 2 or more Vehicles in Household
Demographics Similar to Scandinavians by 2 or more Vehicles in Household
In terms of 2 or more vehicles in household, the demographic groups most similar to Scandinavians are Puget Sound Salish (62.1%, a difference of 0.060%), English (61.9%, a difference of 0.33%), Immigrants from Fiji (62.3%, a difference of 0.34%), Swedish (61.8%, a difference of 0.40%), and Mexican (61.7%, a difference of 0.68%).
| Demographics | Rating | Rank | 2 or more Vehicles in Household |
| Yakama | 100.0 /100 | #1 | Exceptional 64.9% |
| Tongans | 100.0 /100 | #2 | Exceptional 63.5% |
| Danes | 100.0 /100 | #3 | Exceptional 63.3% |
| Norwegians | 100.0 /100 | #4 | Exceptional 62.8% |
| Immigrants | Fiji | 100.0 /100 | #5 | Exceptional 62.3% |
| Scandinavians | 100.0 /100 | #6 | Exceptional 62.1% |
| Puget Sound Salish | 100.0 /100 | #7 | Exceptional 62.1% |
| English | 100.0 /100 | #8 | Exceptional 61.9% |
| Swedes | 100.0 /100 | #9 | Exceptional 61.8% |
| Mexicans | 100.0 /100 | #10 | Exceptional 61.7% |
| Dutch | 100.0 /100 | #11 | Exceptional 61.6% |
| Germans | 100.0 /100 | #12 | Exceptional 61.6% |
| Samoans | 100.0 /100 | #13 | Exceptional 61.5% |
| Czechs | 100.0 /100 | #14 | Exceptional 61.5% |
| Nepalese | 100.0 /100 | #15 | Exceptional 61.4% |
Demographics Similar to Immigrants from France by 2 or more Vehicles in Household
In terms of 2 or more vehicles in household, the demographic groups most similar to Immigrants from France are Immigrants from Colombia (52.0%, a difference of 0.050%), Pima (52.0%, a difference of 0.060%), Honduran (52.0%, a difference of 0.060%), Immigrants from Ireland (52.0%, a difference of 0.080%), and Immigrants from Congo (52.1%, a difference of 0.14%).
| Demographics | Rating | Rank | 2 or more Vehicles in Household |
| Alsatians | 0.6 /100 | #259 | Tragic 52.5% |
| Immigrants | Bahamas | 0.5 /100 | #260 | Tragic 52.5% |
| Immigrants | Australia | 0.5 /100 | #261 | Tragic 52.4% |
| Immigrants | Northern Africa | 0.4 /100 | #262 | Tragic 52.3% |
| Immigrants | Southern Europe | 0.4 /100 | #263 | Tragic 52.3% |
| Immigrants | Latvia | 0.4 /100 | #264 | Tragic 52.2% |
| Immigrants | Congo | 0.3 /100 | #265 | Tragic 52.1% |
| Immigrants | France | 0.2 /100 | #266 | Tragic 52.0% |
| Immigrants | Colombia | 0.2 /100 | #267 | Tragic 52.0% |
| Pima | 0.2 /100 | #268 | Tragic 52.0% |
| Hondurans | 0.2 /100 | #269 | Tragic 52.0% |
| Immigrants | Ireland | 0.2 /100 | #270 | Tragic 52.0% |
| South Americans | 0.2 /100 | #271 | Tragic 51.9% |
| Sub-Saharan Africans | 0.2 /100 | #272 | Tragic 51.9% |
| Israelis | 0.2 /100 | #273 | Tragic 51.9% |