Scandinavian vs Immigrants from Serbia 2 or more Vehicles in Household
COMPARE
Scandinavian
Immigrants from Serbia
2 or more Vehicles in Household
2 or more Vehicles in Household Comparison
Scandinavians
Immigrants from Serbia
62.1%
2 OR MORE VEHICLES IN HOUSEHOLD
100.0/ 100
METRIC RATING
6th/ 347
METRIC RANK
51.3%
2 OR MORE VEHICLES IN HOUSEHOLD
0.1/ 100
METRIC RATING
287th/ 347
METRIC RANK
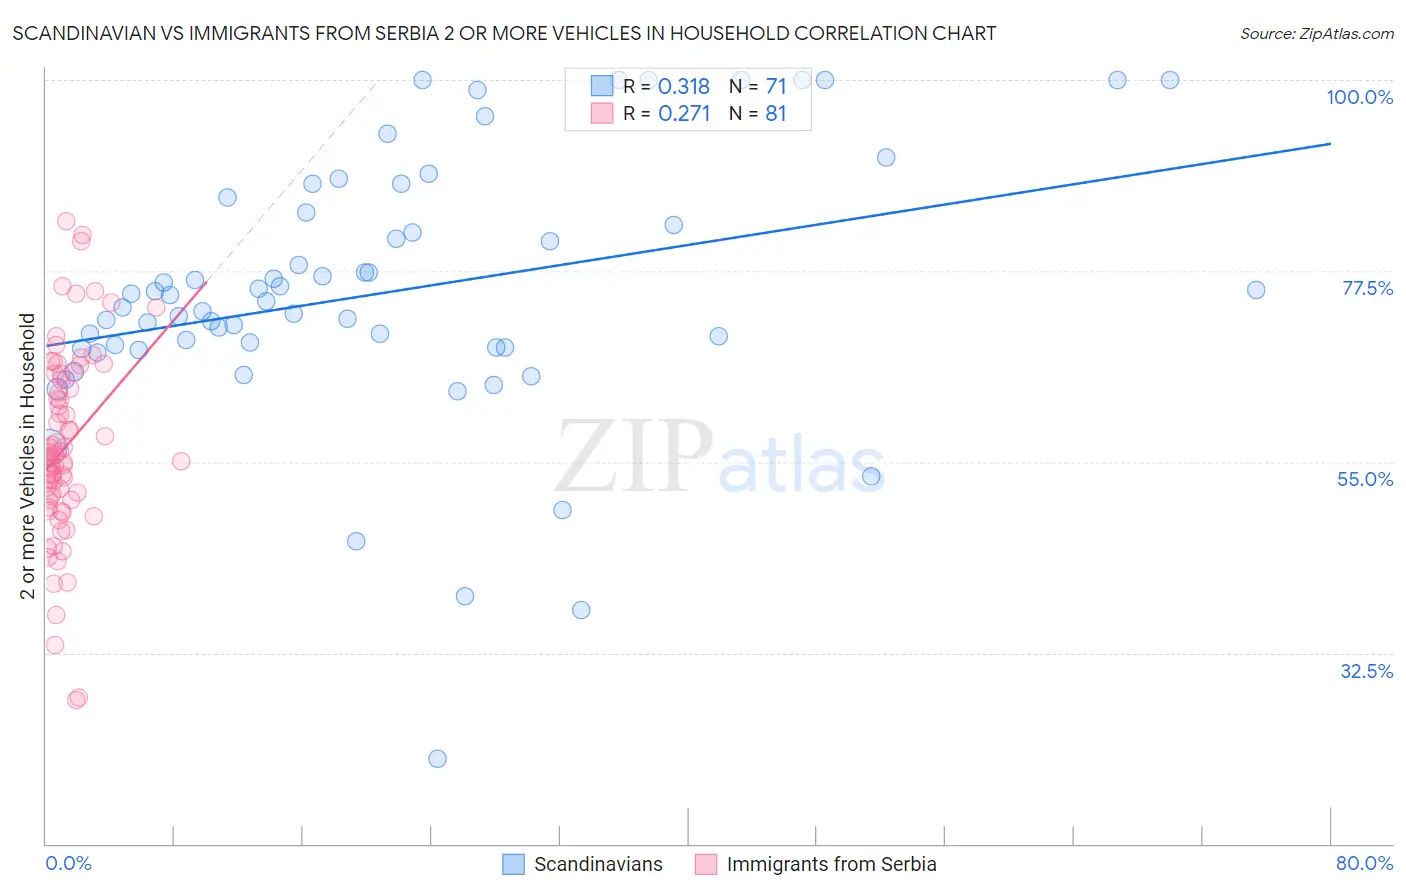
Scandinavian vs Immigrants from Serbia 2 or more Vehicles in Household Correlation Chart
The statistical analysis conducted on geographies consisting of 472,330,499 people shows a mild positive correlation between the proportion of Scandinavians and percentage of households with 2 or more vehicles available in the United States with a correlation coefficient (R) of 0.318 and weighted average of 62.1%. Similarly, the statistical analysis conducted on geographies consisting of 131,726,431 people shows a weak positive correlation between the proportion of Immigrants from Serbia and percentage of households with 2 or more vehicles available in the United States with a correlation coefficient (R) of 0.271 and weighted average of 51.3%, a difference of 21.0%.
2 or more Vehicles in Household Correlation Summary
| Measurement | Scandinavian | Immigrants from Serbia |
| Minimum | 20.0% | 27.0% |
| Maximum | 100.0% | 83.4% |
| Range | 80.0% | 56.4% |
| Mean | 75.0% | 56.7% |
| Median | 73.9% | 55.6% |
| Interquartile 25% (IQ1) | 68.4% | 50.5% |
| Interquartile 75% (IQ3) | 84.4% | 65.0% |
| Interquartile Range (IQR) | 16.0% | 14.5% |
| Standard Deviation (Sample) | 15.6% | 11.1% |
| Standard Deviation (Population) | 15.5% | 11.1% |
Similar Demographics by 2 or more Vehicles in Household
Demographics Similar to Scandinavians by 2 or more Vehicles in Household
In terms of 2 or more vehicles in household, the demographic groups most similar to Scandinavians are Puget Sound Salish (62.1%, a difference of 0.060%), English (61.9%, a difference of 0.33%), Immigrants from Fiji (62.3%, a difference of 0.34%), Swedish (61.8%, a difference of 0.40%), and Mexican (61.7%, a difference of 0.68%).
| Demographics | Rating | Rank | 2 or more Vehicles in Household |
| Yakama | 100.0 /100 | #1 | Exceptional 64.9% |
| Tongans | 100.0 /100 | #2 | Exceptional 63.5% |
| Danes | 100.0 /100 | #3 | Exceptional 63.3% |
| Norwegians | 100.0 /100 | #4 | Exceptional 62.8% |
| Immigrants | Fiji | 100.0 /100 | #5 | Exceptional 62.3% |
| Scandinavians | 100.0 /100 | #6 | Exceptional 62.1% |
| Puget Sound Salish | 100.0 /100 | #7 | Exceptional 62.1% |
| English | 100.0 /100 | #8 | Exceptional 61.9% |
| Swedes | 100.0 /100 | #9 | Exceptional 61.8% |
| Mexicans | 100.0 /100 | #10 | Exceptional 61.7% |
| Dutch | 100.0 /100 | #11 | Exceptional 61.6% |
| Germans | 100.0 /100 | #12 | Exceptional 61.6% |
| Samoans | 100.0 /100 | #13 | Exceptional 61.5% |
| Czechs | 100.0 /100 | #14 | Exceptional 61.5% |
| Nepalese | 100.0 /100 | #15 | Exceptional 61.4% |
Demographics Similar to Immigrants from Serbia by 2 or more Vehicles in Household
In terms of 2 or more vehicles in household, the demographic groups most similar to Immigrants from Serbia are Immigrants from Liberia (51.3%, a difference of 0.020%), Okinawan (51.2%, a difference of 0.12%), Immigrants from Uruguay (51.4%, a difference of 0.17%), Immigrants from Zaire (51.5%, a difference of 0.33%), and Immigrants from China (51.5%, a difference of 0.37%).
| Demographics | Rating | Rank | 2 or more Vehicles in Household |
| Immigrants | Eastern Europe | 0.1 /100 | #280 | Tragic 51.7% |
| Immigrants | Kazakhstan | 0.1 /100 | #281 | Tragic 51.6% |
| Bahamians | 0.1 /100 | #282 | Tragic 51.5% |
| Immigrants | China | 0.1 /100 | #283 | Tragic 51.5% |
| Immigrants | Zaire | 0.1 /100 | #284 | Tragic 51.5% |
| Immigrants | Uruguay | 0.1 /100 | #285 | Tragic 51.4% |
| Immigrants | Liberia | 0.1 /100 | #286 | Tragic 51.3% |
| Immigrants | Serbia | 0.1 /100 | #287 | Tragic 51.3% |
| Okinawans | 0.1 /100 | #288 | Tragic 51.2% |
| Somalis | 0.0 /100 | #289 | Tragic 51.1% |
| Immigrants | Panama | 0.0 /100 | #290 | Tragic 51.1% |
| Belizeans | 0.0 /100 | #291 | Tragic 51.0% |
| Immigrants | Ukraine | 0.0 /100 | #292 | Tragic 50.9% |
| Blacks/African Americans | 0.0 /100 | #293 | Tragic 50.9% |
| Bermudans | 0.0 /100 | #294 | Tragic 50.6% |