Samoan vs Immigrants from Zaire Associate's Degree
COMPARE
Samoan
Immigrants from Zaire
Associate's Degree
Associate's Degree Comparison
Samoans
Immigrants from Zaire
41.1%
ASSOCIATE'S DEGREE
0.2/ 100
METRIC RATING
266th/ 347
METRIC RANK
45.0%
ASSOCIATE'S DEGREE
16.6/ 100
METRIC RATING
211th/ 347
METRIC RANK
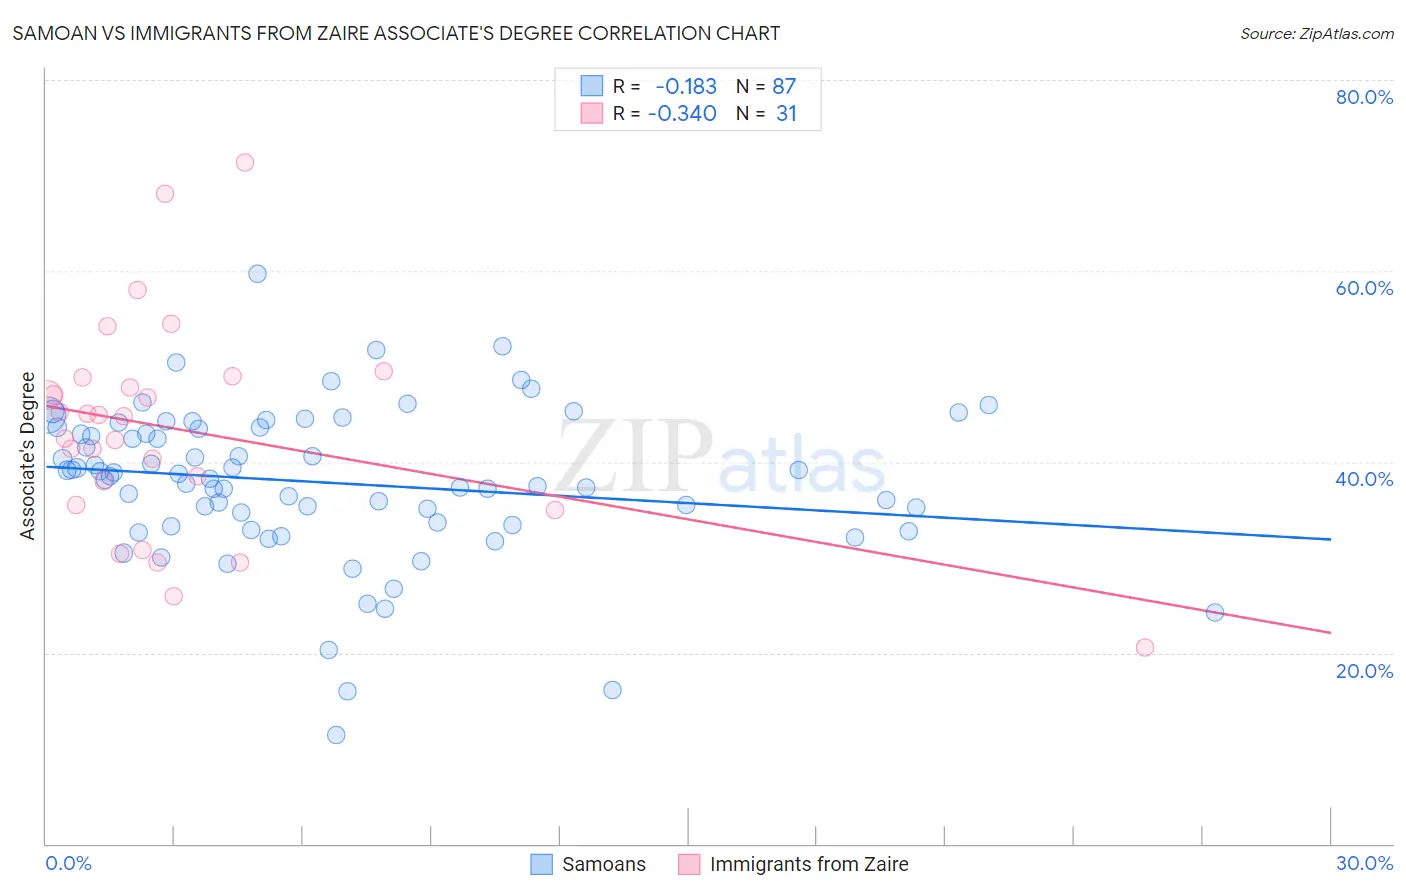
Samoan vs Immigrants from Zaire Associate's Degree Correlation Chart
The statistical analysis conducted on geographies consisting of 225,200,067 people shows a poor negative correlation between the proportion of Samoans and percentage of population with at least associate's degree education in the United States with a correlation coefficient (R) of -0.183 and weighted average of 41.1%. Similarly, the statistical analysis conducted on geographies consisting of 107,255,700 people shows a mild negative correlation between the proportion of Immigrants from Zaire and percentage of population with at least associate's degree education in the United States with a correlation coefficient (R) of -0.340 and weighted average of 45.0%, a difference of 9.3%.
Associate's Degree Correlation Summary
| Measurement | Samoan | Immigrants from Zaire |
| Minimum | 11.4% | 20.5% |
| Maximum | 59.7% | 71.3% |
| Range | 48.3% | 50.8% |
| Mean | 37.8% | 43.3% |
| Median | 38.5% | 44.8% |
| Interquartile 25% (IQ1) | 33.3% | 35.5% |
| Interquartile 75% (IQ3) | 43.6% | 48.8% |
| Interquartile Range (IQR) | 10.3% | 13.3% |
| Standard Deviation (Sample) | 8.1% | 11.2% |
| Standard Deviation (Population) | 8.0% | 11.0% |
Similar Demographics by Associate's Degree
Demographics Similar to Samoans by Associate's Degree
In terms of associate's degree, the demographic groups most similar to Samoans are African (41.1%, a difference of 0.0%), Hawaiian (40.9%, a difference of 0.56%), Osage (41.5%, a difference of 0.76%), Central American Indian (40.8%, a difference of 0.76%), and Immigrants from Jamaica (41.5%, a difference of 0.77%).
| Demographics | Rating | Rank | Associate's Degree |
| Malaysians | 0.4 /100 | #259 | Tragic 41.6% |
| Marshallese | 0.4 /100 | #260 | Tragic 41.6% |
| Nicaraguans | 0.4 /100 | #261 | Tragic 41.5% |
| Bahamians | 0.4 /100 | #262 | Tragic 41.5% |
| Immigrants | Jamaica | 0.3 /100 | #263 | Tragic 41.5% |
| Osage | 0.3 /100 | #264 | Tragic 41.5% |
| Africans | 0.2 /100 | #265 | Tragic 41.1% |
| Samoans | 0.2 /100 | #266 | Tragic 41.1% |
| Hawaiians | 0.2 /100 | #267 | Tragic 40.9% |
| Central American Indians | 0.2 /100 | #268 | Tragic 40.8% |
| Americans | 0.2 /100 | #269 | Tragic 40.8% |
| Chippewa | 0.2 /100 | #270 | Tragic 40.7% |
| Immigrants | Laos | 0.1 /100 | #271 | Tragic 40.7% |
| Belizeans | 0.1 /100 | #272 | Tragic 40.6% |
| Puget Sound Salish | 0.1 /100 | #273 | Tragic 40.5% |
Demographics Similar to Immigrants from Zaire by Associate's Degree
In terms of associate's degree, the demographic groups most similar to Immigrants from Zaire are Immigrants from Costa Rica (45.0%, a difference of 0.010%), Immigrants from Philippines (45.0%, a difference of 0.010%), Dutch (45.0%, a difference of 0.13%), Panamanian (45.1%, a difference of 0.23%), and French Canadian (44.9%, a difference of 0.23%).
| Demographics | Rating | Rank | Associate's Degree |
| Nigerians | 19.1 /100 | #204 | Poor 45.1% |
| Immigrants | Thailand | 18.9 /100 | #205 | Poor 45.1% |
| German Russians | 18.9 /100 | #206 | Poor 45.1% |
| Panamanians | 18.4 /100 | #207 | Poor 45.1% |
| Dutch | 17.6 /100 | #208 | Poor 45.0% |
| Immigrants | Costa Rica | 16.7 /100 | #209 | Poor 45.0% |
| Immigrants | Philippines | 16.7 /100 | #210 | Poor 45.0% |
| Immigrants | Zaire | 16.6 /100 | #211 | Poor 45.0% |
| French Canadians | 15.0 /100 | #212 | Poor 44.9% |
| Immigrants | Ghana | 14.2 /100 | #213 | Poor 44.8% |
| Immigrants | Middle Africa | 12.7 /100 | #214 | Poor 44.7% |
| Immigrants | Panama | 12.4 /100 | #215 | Poor 44.7% |
| Immigrants | Nigeria | 11.4 /100 | #216 | Poor 44.6% |
| Immigrants | Immigrants | 10.5 /100 | #217 | Poor 44.5% |
| Spanish | 9.4 /100 | #218 | Tragic 44.4% |