Samoan vs Immigrants from Eastern Asia 2 or more Vehicles in Household
COMPARE
Samoan
Immigrants from Eastern Asia
2 or more Vehicles in Household
2 or more Vehicles in Household Comparison
Samoans
Immigrants from Eastern Asia
61.5%
2 OR MORE VEHICLES IN HOUSEHOLD
100.0/ 100
METRIC RATING
13th/ 347
METRIC RANK
53.2%
2 OR MORE VEHICLES IN HOUSEHOLD
2.1/ 100
METRIC RATING
242nd/ 347
METRIC RANK
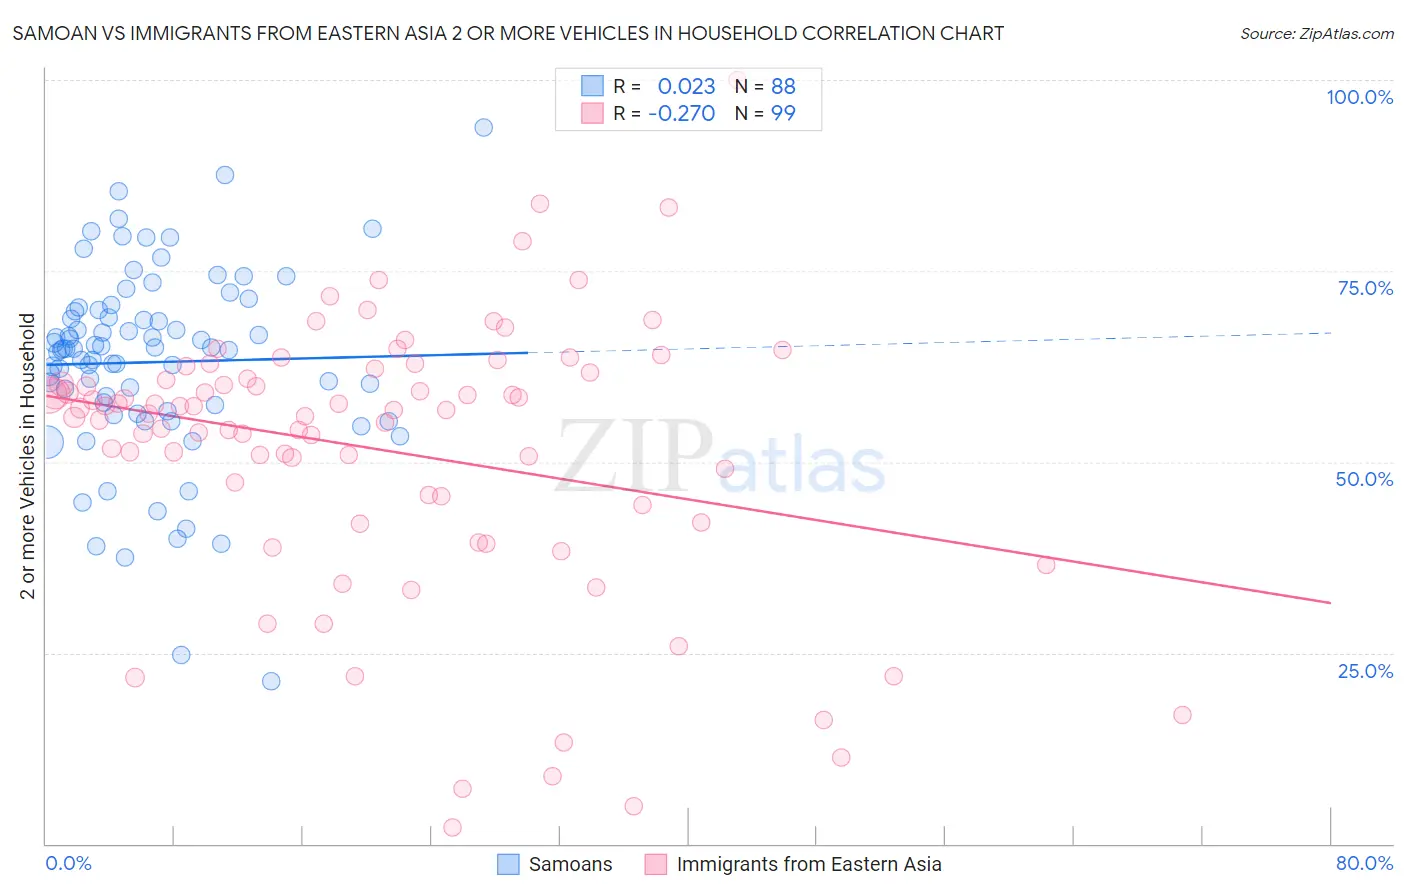
Samoan vs Immigrants from Eastern Asia 2 or more Vehicles in Household Correlation Chart
The statistical analysis conducted on geographies consisting of 225,081,669 people shows no correlation between the proportion of Samoans and percentage of households with 2 or more vehicles available in the United States with a correlation coefficient (R) of 0.023 and weighted average of 61.5%. Similarly, the statistical analysis conducted on geographies consisting of 499,455,795 people shows a weak negative correlation between the proportion of Immigrants from Eastern Asia and percentage of households with 2 or more vehicles available in the United States with a correlation coefficient (R) of -0.270 and weighted average of 53.2%, a difference of 15.6%.
2 or more Vehicles in Household Correlation Summary
| Measurement | Samoan | Immigrants from Eastern Asia |
| Minimum | 21.3% | 2.1% |
| Maximum | 93.8% | 100.0% |
| Range | 72.4% | 97.9% |
| Mean | 63.1% | 51.5% |
| Median | 64.8% | 56.8% |
| Interquartile 25% (IQ1) | 57.1% | 44.3% |
| Interquartile 75% (IQ3) | 69.8% | 61.7% |
| Interquartile Range (IQR) | 12.7% | 17.4% |
| Standard Deviation (Sample) | 12.6% | 18.0% |
| Standard Deviation (Population) | 12.5% | 17.9% |
Similar Demographics by 2 or more Vehicles in Household
Demographics Similar to Samoans by 2 or more Vehicles in Household
In terms of 2 or more vehicles in household, the demographic groups most similar to Samoans are Czech (61.5%, a difference of 0.050%), German (61.6%, a difference of 0.12%), Nepalese (61.4%, a difference of 0.14%), Native Hawaiian (61.4%, a difference of 0.16%), and Basque (61.4%, a difference of 0.22%).
| Demographics | Rating | Rank | 2 or more Vehicles in Household |
| Scandinavians | 100.0 /100 | #6 | Exceptional 62.1% |
| Puget Sound Salish | 100.0 /100 | #7 | Exceptional 62.1% |
| English | 100.0 /100 | #8 | Exceptional 61.9% |
| Swedes | 100.0 /100 | #9 | Exceptional 61.8% |
| Mexicans | 100.0 /100 | #10 | Exceptional 61.7% |
| Dutch | 100.0 /100 | #11 | Exceptional 61.6% |
| Germans | 100.0 /100 | #12 | Exceptional 61.6% |
| Samoans | 100.0 /100 | #13 | Exceptional 61.5% |
| Czechs | 100.0 /100 | #14 | Exceptional 61.5% |
| Nepalese | 100.0 /100 | #15 | Exceptional 61.4% |
| Native Hawaiians | 100.0 /100 | #16 | Exceptional 61.4% |
| Basques | 100.0 /100 | #17 | Exceptional 61.4% |
| Europeans | 100.0 /100 | #18 | Exceptional 61.4% |
| Scottish | 100.0 /100 | #19 | Exceptional 61.2% |
| Sri Lankans | 100.0 /100 | #20 | Exceptional 61.0% |
Demographics Similar to Immigrants from Eastern Asia by 2 or more Vehicles in Household
In terms of 2 or more vehicles in household, the demographic groups most similar to Immigrants from Eastern Asia are Immigrants from Sierra Leone (53.2%, a difference of 0.0%), Immigrants from Europe (53.2%, a difference of 0.030%), Cambodian (53.3%, a difference of 0.10%), Immigrants from Armenia (53.3%, a difference of 0.11%), and Macedonian (53.3%, a difference of 0.17%).
| Demographics | Rating | Rank | 2 or more Vehicles in Household |
| Immigrants | Middle Africa | 3.0 /100 | #235 | Tragic 53.4% |
| Indonesians | 2.7 /100 | #236 | Tragic 53.4% |
| Macedonians | 2.4 /100 | #237 | Tragic 53.3% |
| Immigrants | Armenia | 2.3 /100 | #238 | Tragic 53.3% |
| Cambodians | 2.3 /100 | #239 | Tragic 53.3% |
| Immigrants | Europe | 2.1 /100 | #240 | Tragic 53.2% |
| Immigrants | Sierra Leone | 2.1 /100 | #241 | Tragic 53.2% |
| Immigrants | Eastern Asia | 2.1 /100 | #242 | Tragic 53.2% |
| Ethiopians | 1.7 /100 | #243 | Tragic 53.1% |
| Indians (Asian) | 1.7 /100 | #244 | Tragic 53.1% |
| Immigrants | Ethiopia | 1.5 /100 | #245 | Tragic 53.0% |
| Immigrants | Nigeria | 1.2 /100 | #246 | Tragic 52.9% |
| Sierra Leoneans | 1.2 /100 | #247 | Tragic 52.9% |
| Colombians | 1.1 /100 | #248 | Tragic 52.9% |
| Immigrants | Brazil | 1.0 /100 | #249 | Tragic 52.8% |