Samoan vs Immigrants from Eastern Asia No Schooling Completed
COMPARE
Samoan
Immigrants from Eastern Asia
No Schooling Completed
No Schooling Completed Comparison
Samoans
Immigrants from Eastern Asia
2.3%
NO SCHOOLING COMPLETED
8.2/ 100
METRIC RATING
214th/ 347
METRIC RANK
2.4%
NO SCHOOLING COMPLETED
2.0/ 100
METRIC RATING
237th/ 347
METRIC RANK
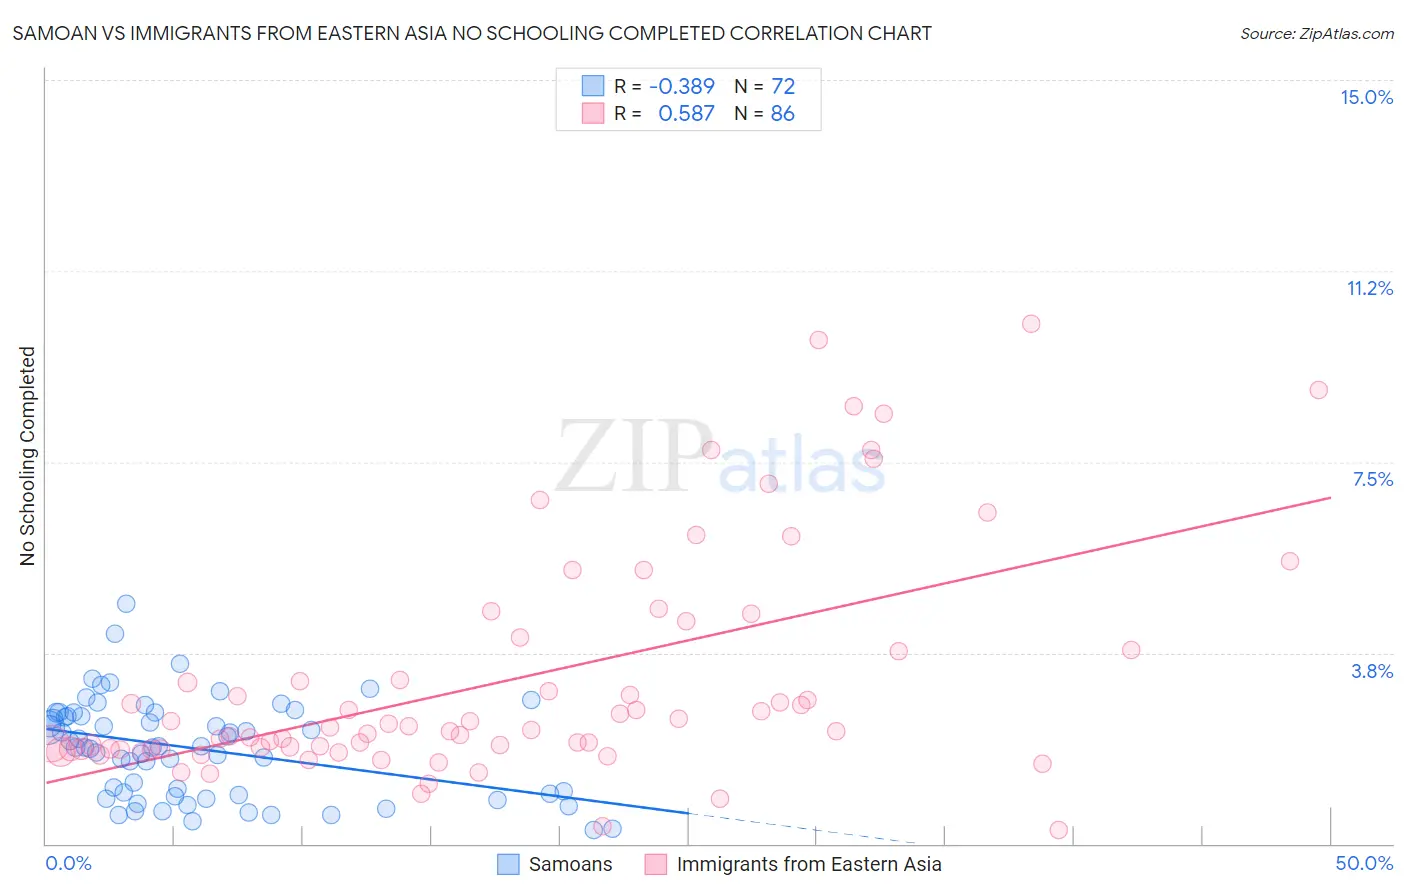
Samoan vs Immigrants from Eastern Asia No Schooling Completed Correlation Chart
The statistical analysis conducted on geographies consisting of 223,861,902 people shows a mild negative correlation between the proportion of Samoans and percentage of population with no schooling in the United States with a correlation coefficient (R) of -0.389 and weighted average of 2.3%. Similarly, the statistical analysis conducted on geographies consisting of 491,002,853 people shows a substantial positive correlation between the proportion of Immigrants from Eastern Asia and percentage of population with no schooling in the United States with a correlation coefficient (R) of 0.587 and weighted average of 2.4%, a difference of 4.5%.
No Schooling Completed Correlation Summary
| Measurement | Samoan | Immigrants from Eastern Asia |
| Minimum | 0.26% | 0.26% |
| Maximum | 4.7% | 10.2% |
| Range | 4.5% | 10.0% |
| Mean | 1.9% | 3.2% |
| Median | 1.9% | 2.3% |
| Interquartile 25% (IQ1) | 0.97% | 1.9% |
| Interquartile 75% (IQ3) | 2.5% | 3.8% |
| Interquartile Range (IQR) | 1.6% | 1.9% |
| Standard Deviation (Sample) | 0.95% | 2.2% |
| Standard Deviation (Population) | 0.95% | 2.2% |
Similar Demographics by No Schooling Completed
Demographics Similar to Samoans by No Schooling Completed
In terms of no schooling completed, the demographic groups most similar to Samoans are Ute (2.3%, a difference of 0.040%), Immigrants from Morocco (2.3%, a difference of 0.23%), Immigrants from Panama (2.3%, a difference of 0.24%), Immigrants from Zaire (2.3%, a difference of 0.43%), and Tongan (2.3%, a difference of 0.63%).
| Demographics | Rating | Rank | No Schooling Completed |
| South American Indians | 11.0 /100 | #207 | Poor 2.2% |
| Uruguayans | 11.0 /100 | #208 | Poor 2.2% |
| Immigrants | Oceania | 10.2 /100 | #209 | Poor 2.2% |
| Natives/Alaskans | 10.0 /100 | #210 | Tragic 2.2% |
| Immigrants | Panama | 8.8 /100 | #211 | Tragic 2.3% |
| Immigrants | Morocco | 8.7 /100 | #212 | Tragic 2.3% |
| Ute | 8.2 /100 | #213 | Tragic 2.3% |
| Samoans | 8.2 /100 | #214 | Tragic 2.3% |
| Immigrants | Zaire | 7.2 /100 | #215 | Tragic 2.3% |
| Tongans | 6.8 /100 | #216 | Tragic 2.3% |
| Immigrants | Syria | 6.6 /100 | #217 | Tragic 2.3% |
| Immigrants | Nepal | 6.4 /100 | #218 | Tragic 2.3% |
| Senegalese | 5.6 /100 | #219 | Tragic 2.3% |
| Immigrants | Costa Rica | 5.1 /100 | #220 | Tragic 2.3% |
| Immigrants | Sudan | 5.0 /100 | #221 | Tragic 2.3% |
Demographics Similar to Immigrants from Eastern Asia by No Schooling Completed
In terms of no schooling completed, the demographic groups most similar to Immigrants from Eastern Asia are Iraqi (2.4%, a difference of 0.20%), Paiute (2.4%, a difference of 0.21%), Liberian (2.4%, a difference of 0.33%), Immigrants from Senegal (2.4%, a difference of 0.56%), and Korean (2.4%, a difference of 0.62%).
| Demographics | Rating | Rank | No Schooling Completed |
| Puerto Ricans | 3.4 /100 | #230 | Tragic 2.3% |
| Immigrants | Uruguay | 3.4 /100 | #231 | Tragic 2.3% |
| Colombians | 3.2 /100 | #232 | Tragic 2.3% |
| Immigrants | Malaysia | 2.8 /100 | #233 | Tragic 2.3% |
| Nigerians | 2.6 /100 | #234 | Tragic 2.3% |
| Immigrants | Western Asia | 2.6 /100 | #235 | Tragic 2.3% |
| Iraqis | 2.2 /100 | #236 | Tragic 2.4% |
| Immigrants | Eastern Asia | 2.0 /100 | #237 | Tragic 2.4% |
| Paiute | 1.9 /100 | #238 | Tragic 2.4% |
| Liberians | 1.8 /100 | #239 | Tragic 2.4% |
| Immigrants | Senegal | 1.7 /100 | #240 | Tragic 2.4% |
| Koreans | 1.7 /100 | #241 | Tragic 2.4% |
| Immigrants | Indonesia | 1.5 /100 | #242 | Tragic 2.4% |
| South Americans | 1.5 /100 | #243 | Tragic 2.4% |
| Peruvians | 1.4 /100 | #244 | Tragic 2.4% |