Immigrants from Cabo Verde vs Immigrants from Eastern Asia 2 or more Vehicles in Household
COMPARE
Immigrants from Cabo Verde
Immigrants from Eastern Asia
2 or more Vehicles in Household
2 or more Vehicles in Household Comparison
Immigrants from Cabo Verde
Immigrants from Eastern Asia
43.3%
2 OR MORE VEHICLES IN HOUSEHOLD
0.0/ 100
METRIC RATING
324th/ 347
METRIC RANK
53.2%
2 OR MORE VEHICLES IN HOUSEHOLD
2.1/ 100
METRIC RATING
242nd/ 347
METRIC RANK
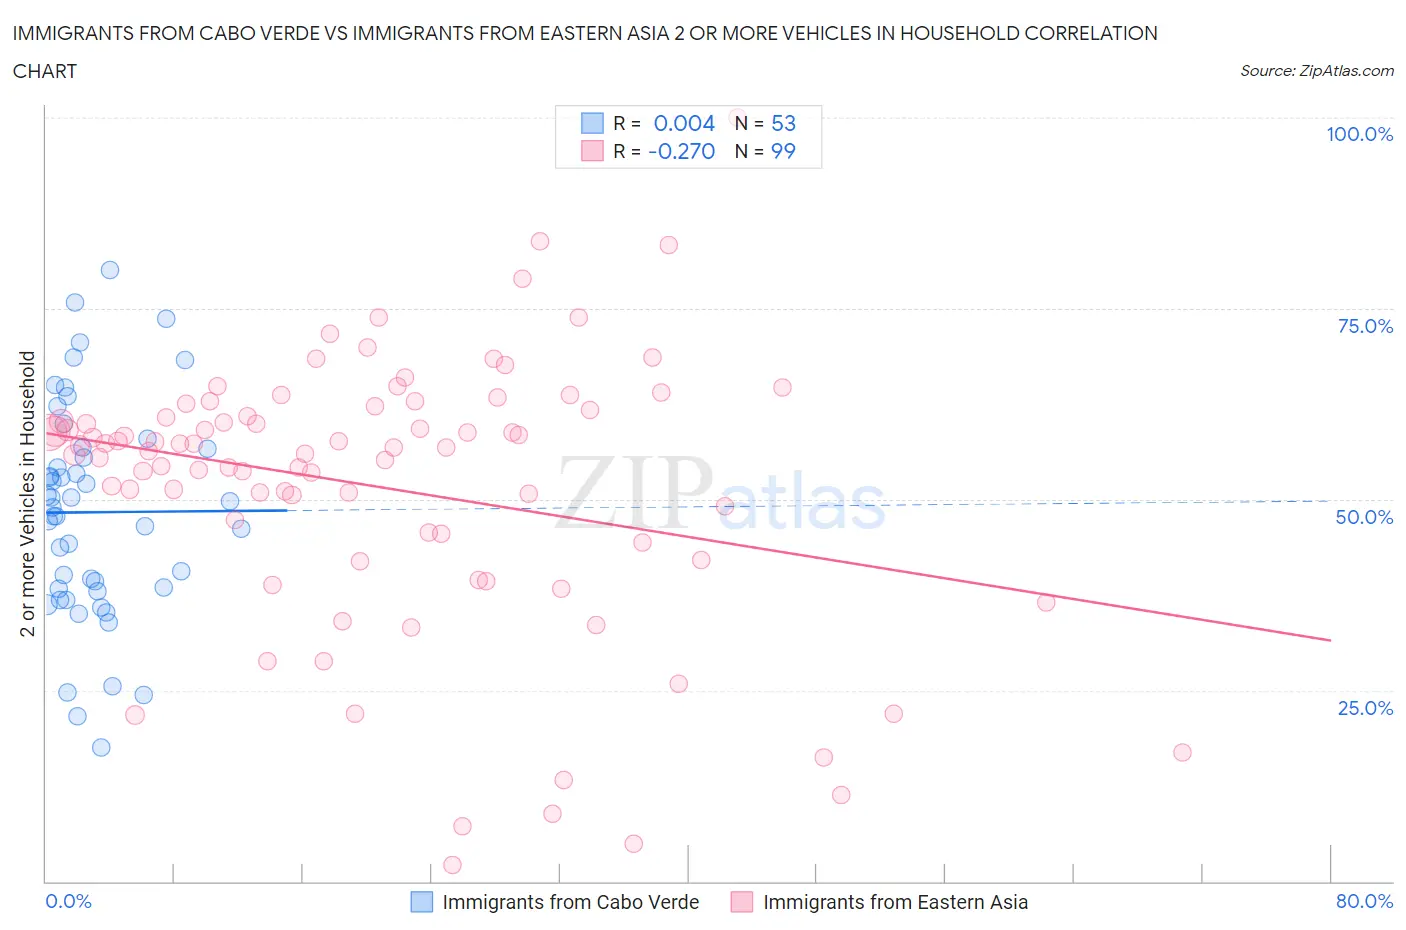
Immigrants from Cabo Verde vs Immigrants from Eastern Asia 2 or more Vehicles in Household Correlation Chart
The statistical analysis conducted on geographies consisting of 38,145,332 people shows no correlation between the proportion of Immigrants from Cabo Verde and percentage of households with 2 or more vehicles available in the United States with a correlation coefficient (R) of 0.004 and weighted average of 43.3%. Similarly, the statistical analysis conducted on geographies consisting of 499,455,795 people shows a weak negative correlation between the proportion of Immigrants from Eastern Asia and percentage of households with 2 or more vehicles available in the United States with a correlation coefficient (R) of -0.270 and weighted average of 53.2%, a difference of 22.8%.
2 or more Vehicles in Household Correlation Summary
| Measurement | Immigrants from Cabo Verde | Immigrants from Eastern Asia |
| Minimum | 17.5% | 2.1% |
| Maximum | 80.1% | 100.0% |
| Range | 62.6% | 97.9% |
| Mean | 48.3% | 51.5% |
| Median | 48.9% | 56.8% |
| Interquartile 25% (IQ1) | 38.1% | 44.3% |
| Interquartile 75% (IQ3) | 56.7% | 61.7% |
| Interquartile Range (IQR) | 18.6% | 17.4% |
| Standard Deviation (Sample) | 14.1% | 18.0% |
| Standard Deviation (Population) | 14.0% | 17.9% |
Similar Demographics by 2 or more Vehicles in Household
Demographics Similar to Immigrants from Cabo Verde by 2 or more Vehicles in Household
In terms of 2 or more vehicles in household, the demographic groups most similar to Immigrants from Cabo Verde are Immigrants from West Indies (43.1%, a difference of 0.57%), Immigrants from Senegal (43.0%, a difference of 0.72%), Immigrants from Yemen (42.8%, a difference of 1.1%), Inupiat (42.6%, a difference of 1.6%), and Immigrants from Caribbean (44.2%, a difference of 2.1%).
| Demographics | Rating | Rank | 2 or more Vehicles in Household |
| Immigrants | Haiti | 0.0 /100 | #317 | Tragic 46.5% |
| Immigrants | Albania | 0.0 /100 | #318 | Tragic 46.0% |
| Jamaicans | 0.0 /100 | #319 | Tragic 45.8% |
| Soviet Union | 0.0 /100 | #320 | Tragic 45.7% |
| Immigrants | Jamaica | 0.0 /100 | #321 | Tragic 44.5% |
| Senegalese | 0.0 /100 | #322 | Tragic 44.2% |
| Immigrants | Caribbean | 0.0 /100 | #323 | Tragic 44.2% |
| Immigrants | Cabo Verde | 0.0 /100 | #324 | Tragic 43.3% |
| Immigrants | West Indies | 0.0 /100 | #325 | Tragic 43.1% |
| Immigrants | Senegal | 0.0 /100 | #326 | Tragic 43.0% |
| Immigrants | Yemen | 0.0 /100 | #327 | Tragic 42.8% |
| Inupiat | 0.0 /100 | #328 | Tragic 42.6% |
| Ecuadorians | 0.0 /100 | #329 | Tragic 42.0% |
| Immigrants | Dominica | 0.0 /100 | #330 | Tragic 41.6% |
| West Indians | 0.0 /100 | #331 | Tragic 41.3% |
Demographics Similar to Immigrants from Eastern Asia by 2 or more Vehicles in Household
In terms of 2 or more vehicles in household, the demographic groups most similar to Immigrants from Eastern Asia are Immigrants from Sierra Leone (53.2%, a difference of 0.0%), Immigrants from Europe (53.2%, a difference of 0.030%), Cambodian (53.3%, a difference of 0.10%), Immigrants from Armenia (53.3%, a difference of 0.11%), and Macedonian (53.3%, a difference of 0.17%).
| Demographics | Rating | Rank | 2 or more Vehicles in Household |
| Immigrants | Middle Africa | 3.0 /100 | #235 | Tragic 53.4% |
| Indonesians | 2.7 /100 | #236 | Tragic 53.4% |
| Macedonians | 2.4 /100 | #237 | Tragic 53.3% |
| Immigrants | Armenia | 2.3 /100 | #238 | Tragic 53.3% |
| Cambodians | 2.3 /100 | #239 | Tragic 53.3% |
| Immigrants | Europe | 2.1 /100 | #240 | Tragic 53.2% |
| Immigrants | Sierra Leone | 2.1 /100 | #241 | Tragic 53.2% |
| Immigrants | Eastern Asia | 2.1 /100 | #242 | Tragic 53.2% |
| Ethiopians | 1.7 /100 | #243 | Tragic 53.1% |
| Indians (Asian) | 1.7 /100 | #244 | Tragic 53.1% |
| Immigrants | Ethiopia | 1.5 /100 | #245 | Tragic 53.0% |
| Immigrants | Nigeria | 1.2 /100 | #246 | Tragic 52.9% |
| Sierra Leoneans | 1.2 /100 | #247 | Tragic 52.9% |
| Colombians | 1.1 /100 | #248 | Tragic 52.9% |
| Immigrants | Brazil | 1.0 /100 | #249 | Tragic 52.8% |