Aleut vs Immigrants from Eastern Asia 2 or more Vehicles in Household
COMPARE
Aleut
Immigrants from Eastern Asia
2 or more Vehicles in Household
2 or more Vehicles in Household Comparison
Aleuts
Immigrants from Eastern Asia
54.1%
2 OR MORE VEHICLES IN HOUSEHOLD
9.3/ 100
METRIC RATING
215th/ 347
METRIC RANK
53.2%
2 OR MORE VEHICLES IN HOUSEHOLD
2.1/ 100
METRIC RATING
242nd/ 347
METRIC RANK
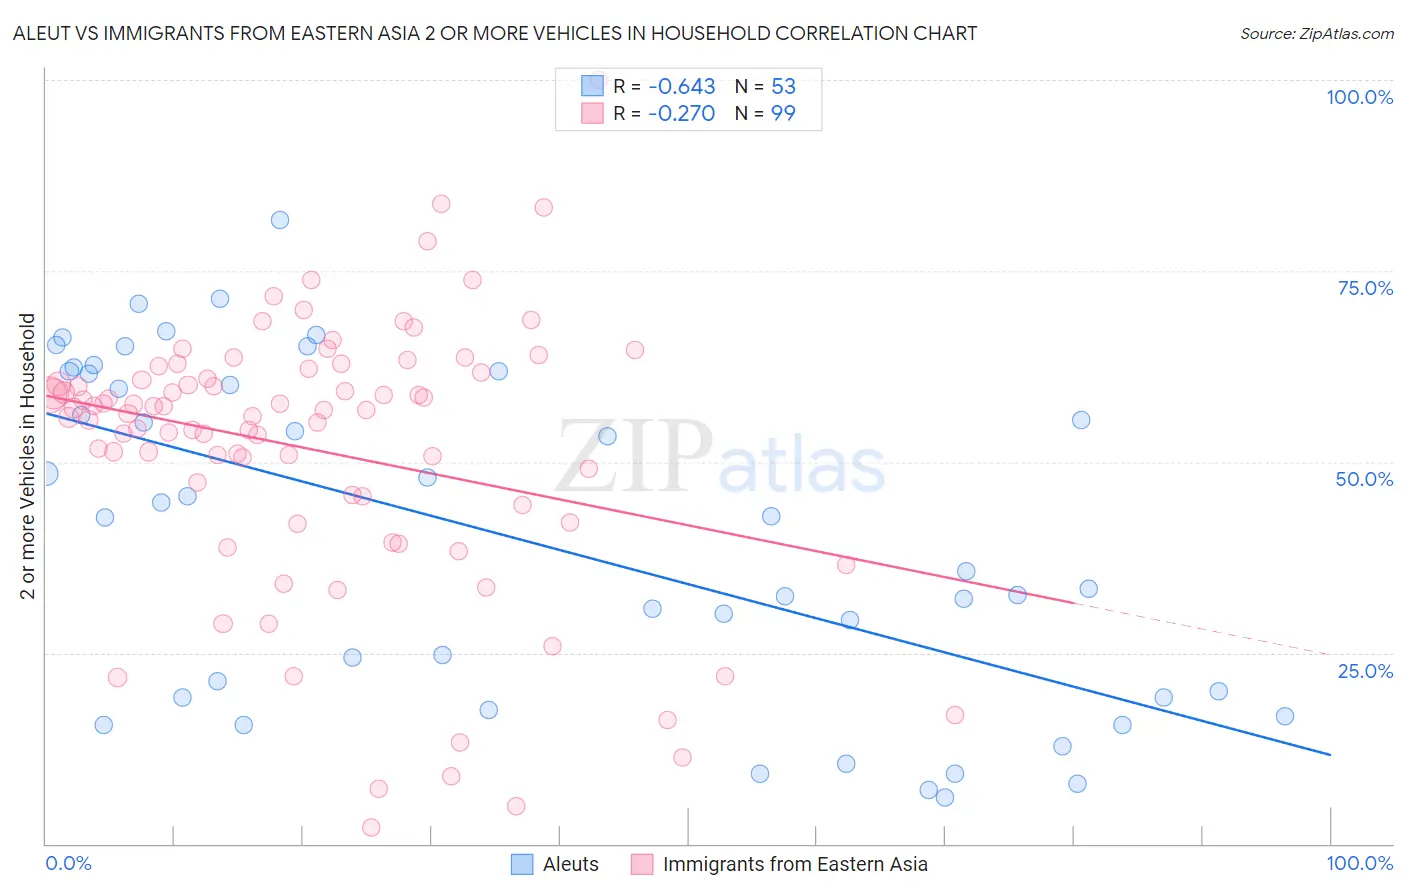
Aleut vs Immigrants from Eastern Asia 2 or more Vehicles in Household Correlation Chart
The statistical analysis conducted on geographies consisting of 61,767,595 people shows a significant negative correlation between the proportion of Aleuts and percentage of households with 2 or more vehicles available in the United States with a correlation coefficient (R) of -0.643 and weighted average of 54.1%. Similarly, the statistical analysis conducted on geographies consisting of 499,455,795 people shows a weak negative correlation between the proportion of Immigrants from Eastern Asia and percentage of households with 2 or more vehicles available in the United States with a correlation coefficient (R) of -0.270 and weighted average of 53.2%, a difference of 1.6%.
2 or more Vehicles in Household Correlation Summary
| Measurement | Aleut | Immigrants from Eastern Asia |
| Minimum | 6.1% | 2.1% |
| Maximum | 81.6% | 100.0% |
| Range | 75.6% | 97.9% |
| Mean | 40.1% | 51.5% |
| Median | 42.7% | 56.8% |
| Interquartile 25% (IQ1) | 19.2% | 44.3% |
| Interquartile 75% (IQ3) | 61.7% | 61.7% |
| Interquartile Range (IQR) | 42.5% | 17.4% |
| Standard Deviation (Sample) | 21.7% | 18.0% |
| Standard Deviation (Population) | 21.5% | 17.9% |
Similar Demographics by 2 or more Vehicles in Household
Demographics Similar to Aleuts by 2 or more Vehicles in Household
In terms of 2 or more vehicles in household, the demographic groups most similar to Aleuts are Immigrants from Western Asia (54.1%, a difference of 0.0%), Immigrants from Czechoslovakia (54.1%, a difference of 0.010%), Guatemalan (54.1%, a difference of 0.030%), Immigrants from Chile (54.2%, a difference of 0.20%), and Immigrants from Hungary (54.2%, a difference of 0.22%).
| Demographics | Rating | Rank | 2 or more Vehicles in Household |
| Egyptians | 12.0 /100 | #208 | Poor 54.3% |
| Immigrants | Bulgaria | 12.0 /100 | #209 | Poor 54.3% |
| Immigrants | Saudi Arabia | 11.3 /100 | #210 | Poor 54.2% |
| Immigrants | Hungary | 11.3 /100 | #211 | Poor 54.2% |
| Immigrants | Chile | 11.1 /100 | #212 | Poor 54.2% |
| Guatemalans | 9.6 /100 | #213 | Tragic 54.1% |
| Immigrants | Czechoslovakia | 9.4 /100 | #214 | Tragic 54.1% |
| Aleuts | 9.3 /100 | #215 | Tragic 54.1% |
| Immigrants | Western Asia | 9.3 /100 | #216 | Tragic 54.1% |
| Immigrants | Burma/Myanmar | 7.1 /100 | #217 | Tragic 53.9% |
| Immigrants | Argentina | 6.8 /100 | #218 | Tragic 53.9% |
| South American Indians | 6.5 /100 | #219 | Tragic 53.9% |
| Taiwanese | 6.3 /100 | #220 | Tragic 53.9% |
| Immigrants | Singapore | 6.3 /100 | #221 | Tragic 53.9% |
| Kiowa | 6.2 /100 | #222 | Tragic 53.9% |
Demographics Similar to Immigrants from Eastern Asia by 2 or more Vehicles in Household
In terms of 2 or more vehicles in household, the demographic groups most similar to Immigrants from Eastern Asia are Immigrants from Sierra Leone (53.2%, a difference of 0.0%), Immigrants from Europe (53.2%, a difference of 0.030%), Cambodian (53.3%, a difference of 0.10%), Immigrants from Armenia (53.3%, a difference of 0.11%), and Macedonian (53.3%, a difference of 0.17%).
| Demographics | Rating | Rank | 2 or more Vehicles in Household |
| Immigrants | Middle Africa | 3.0 /100 | #235 | Tragic 53.4% |
| Indonesians | 2.7 /100 | #236 | Tragic 53.4% |
| Macedonians | 2.4 /100 | #237 | Tragic 53.3% |
| Immigrants | Armenia | 2.3 /100 | #238 | Tragic 53.3% |
| Cambodians | 2.3 /100 | #239 | Tragic 53.3% |
| Immigrants | Europe | 2.1 /100 | #240 | Tragic 53.2% |
| Immigrants | Sierra Leone | 2.1 /100 | #241 | Tragic 53.2% |
| Immigrants | Eastern Asia | 2.1 /100 | #242 | Tragic 53.2% |
| Ethiopians | 1.7 /100 | #243 | Tragic 53.1% |
| Indians (Asian) | 1.7 /100 | #244 | Tragic 53.1% |
| Immigrants | Ethiopia | 1.5 /100 | #245 | Tragic 53.0% |
| Immigrants | Nigeria | 1.2 /100 | #246 | Tragic 52.9% |
| Sierra Leoneans | 1.2 /100 | #247 | Tragic 52.9% |
| Colombians | 1.1 /100 | #248 | Tragic 52.9% |
| Immigrants | Brazil | 1.0 /100 | #249 | Tragic 52.8% |