Samoan vs Immigrants from Eastern Asia Average Family Size
COMPARE
Samoan
Immigrants from Eastern Asia
Average Family Size
Average Family Size Comparison
Samoans
Immigrants from Eastern Asia
3.42
AVERAGE FAMILY SIZE
100.0/ 100
METRIC RATING
30th/ 347
METRIC RANK
3.22
AVERAGE FAMILY SIZE
40.8/ 100
METRIC RATING
184th/ 347
METRIC RANK
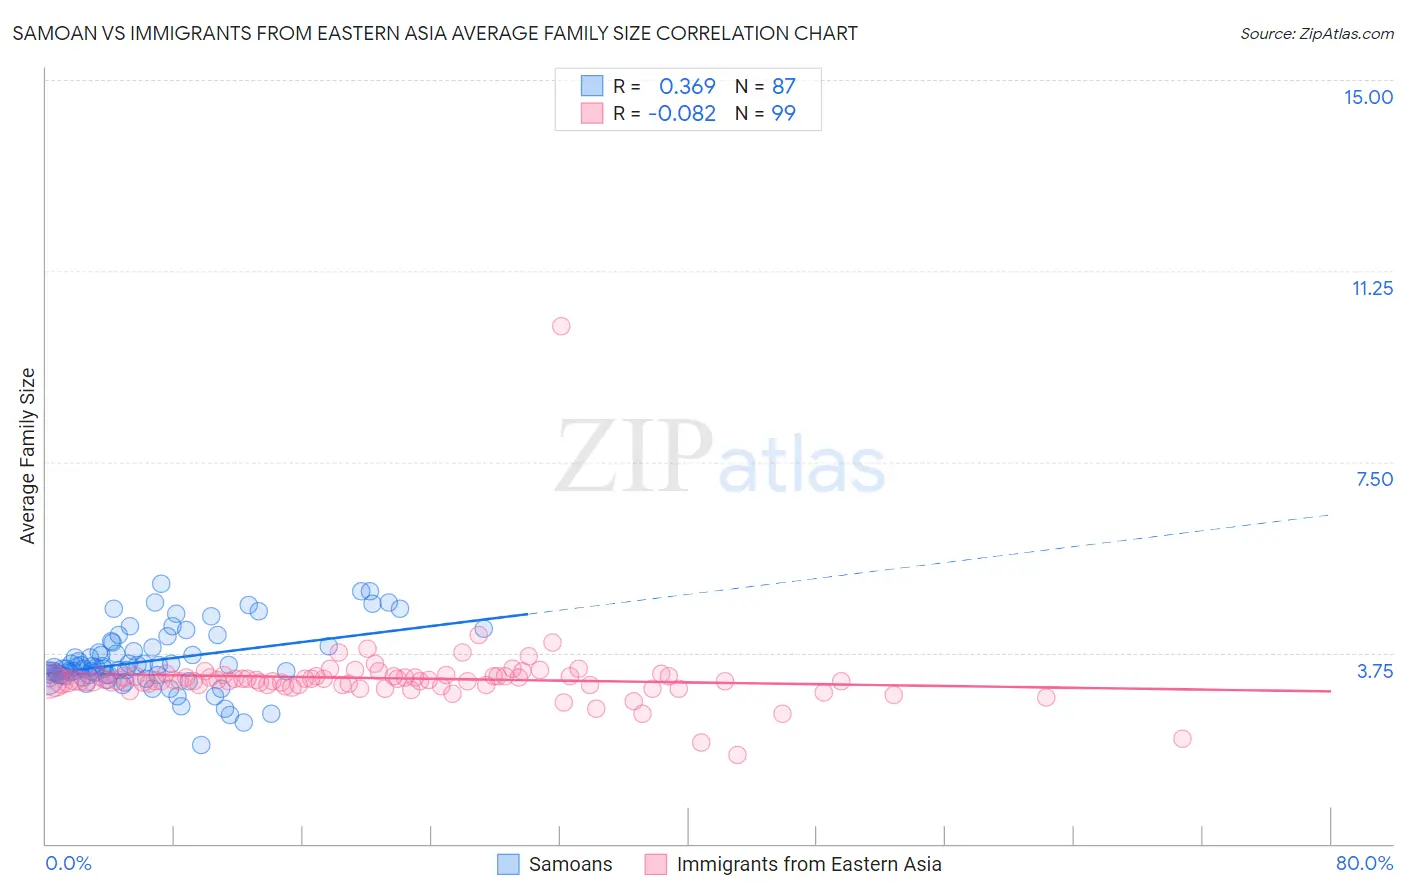
Samoan vs Immigrants from Eastern Asia Average Family Size Correlation Chart
The statistical analysis conducted on geographies consisting of 225,071,591 people shows a mild positive correlation between the proportion of Samoans and average family size in the United States with a correlation coefficient (R) of 0.369 and weighted average of 3.42. Similarly, the statistical analysis conducted on geographies consisting of 499,398,667 people shows a slight negative correlation between the proportion of Immigrants from Eastern Asia and average family size in the United States with a correlation coefficient (R) of -0.082 and weighted average of 3.22, a difference of 6.1%.
Average Family Size Correlation Summary
| Measurement | Samoan | Immigrants from Eastern Asia |
| Minimum | 1.93 | 1.75 |
| Maximum | 5.11 | 10.17 |
| Range | 3.18 | 8.42 |
| Mean | 3.60 | 3.25 |
| Median | 3.45 | 3.21 |
| Interquartile 25% (IQ1) | 3.30 | 3.12 |
| Interquartile 75% (IQ3) | 3.89 | 3.29 |
| Interquartile Range (IQR) | 0.58 | 0.17 |
| Standard Deviation (Sample) | 0.60 | 0.77 |
| Standard Deviation (Population) | 0.60 | 0.77 |
Similar Demographics by Average Family Size
Demographics Similar to Samoans by Average Family Size
In terms of average family size, the demographic groups most similar to Samoans are Nepalese (3.42, a difference of 0.030%), Immigrants from Latin America (3.42, a difference of 0.12%), Central American (3.41, a difference of 0.20%), Mexican American Indian (3.43, a difference of 0.24%), and Native Hawaiian (3.43, a difference of 0.25%).
| Demographics | Rating | Rank | Average Family Size |
| Immigrants | Fiji | 100.0 /100 | #23 | Exceptional 3.45 |
| Natives/Alaskans | 100.0 /100 | #24 | Exceptional 3.45 |
| Yakama | 100.0 /100 | #25 | Exceptional 3.45 |
| Native Hawaiians | 100.0 /100 | #26 | Exceptional 3.43 |
| Mexican American Indians | 100.0 /100 | #27 | Exceptional 3.43 |
| Immigrants | Latin America | 100.0 /100 | #28 | Exceptional 3.42 |
| Nepalese | 100.0 /100 | #29 | Exceptional 3.42 |
| Samoans | 100.0 /100 | #30 | Exceptional 3.42 |
| Central Americans | 100.0 /100 | #31 | Exceptional 3.41 |
| Immigrants | Guatemala | 100.0 /100 | #32 | Exceptional 3.41 |
| Hawaiians | 100.0 /100 | #33 | Exceptional 3.41 |
| Hispanics or Latinos | 100.0 /100 | #34 | Exceptional 3.41 |
| Guatemalans | 100.0 /100 | #35 | Exceptional 3.40 |
| Immigrants | Guyana | 100.0 /100 | #36 | Exceptional 3.40 |
| Guyanese | 100.0 /100 | #37 | Exceptional 3.40 |
Demographics Similar to Immigrants from Eastern Asia by Average Family Size
In terms of average family size, the demographic groups most similar to Immigrants from Eastern Asia are Immigrants from Northern Africa (3.22, a difference of 0.020%), Immigrants from Sri Lanka (3.22, a difference of 0.020%), Immigrants from Argentina (3.22, a difference of 0.020%), Immigrants from Malaysia (3.22, a difference of 0.030%), and Thai (3.22, a difference of 0.050%).
| Demographics | Rating | Rank | Average Family Size |
| Argentineans | 47.4 /100 | #177 | Average 3.23 |
| Spaniards | 47.2 /100 | #178 | Average 3.23 |
| Immigrants | Korea | 46.9 /100 | #179 | Average 3.23 |
| Palestinians | 46.6 /100 | #180 | Average 3.23 |
| Spanish | 44.8 /100 | #181 | Average 3.23 |
| Moroccans | 44.2 /100 | #182 | Average 3.22 |
| Immigrants | Northern Africa | 41.7 /100 | #183 | Average 3.22 |
| Immigrants | Eastern Asia | 40.8 /100 | #184 | Average 3.22 |
| Immigrants | Sri Lanka | 39.8 /100 | #185 | Fair 3.22 |
| Immigrants | Argentina | 39.8 /100 | #186 | Fair 3.22 |
| Immigrants | Malaysia | 39.0 /100 | #187 | Fair 3.22 |
| Thais | 38.3 /100 | #188 | Fair 3.22 |
| Pakistanis | 33.7 /100 | #189 | Fair 3.22 |
| Burmese | 31.0 /100 | #190 | Fair 3.22 |
| Immigrants | Zaire | 30.5 /100 | #191 | Fair 3.22 |