Pueblo vs Cuban 3 or more Vehicles in Household
COMPARE
Pueblo
Cuban
3 or more Vehicles in Household
3 or more Vehicles in Household Comparison
Pueblo
Cubans
23.0%
3 OR MORE VEHICLES IN HOUSEHOLD
100.0/ 100
METRIC RATING
32nd/ 347
METRIC RANK
19.3%
3 OR MORE VEHICLES IN HOUSEHOLD
36.6/ 100
METRIC RATING
182nd/ 347
METRIC RANK
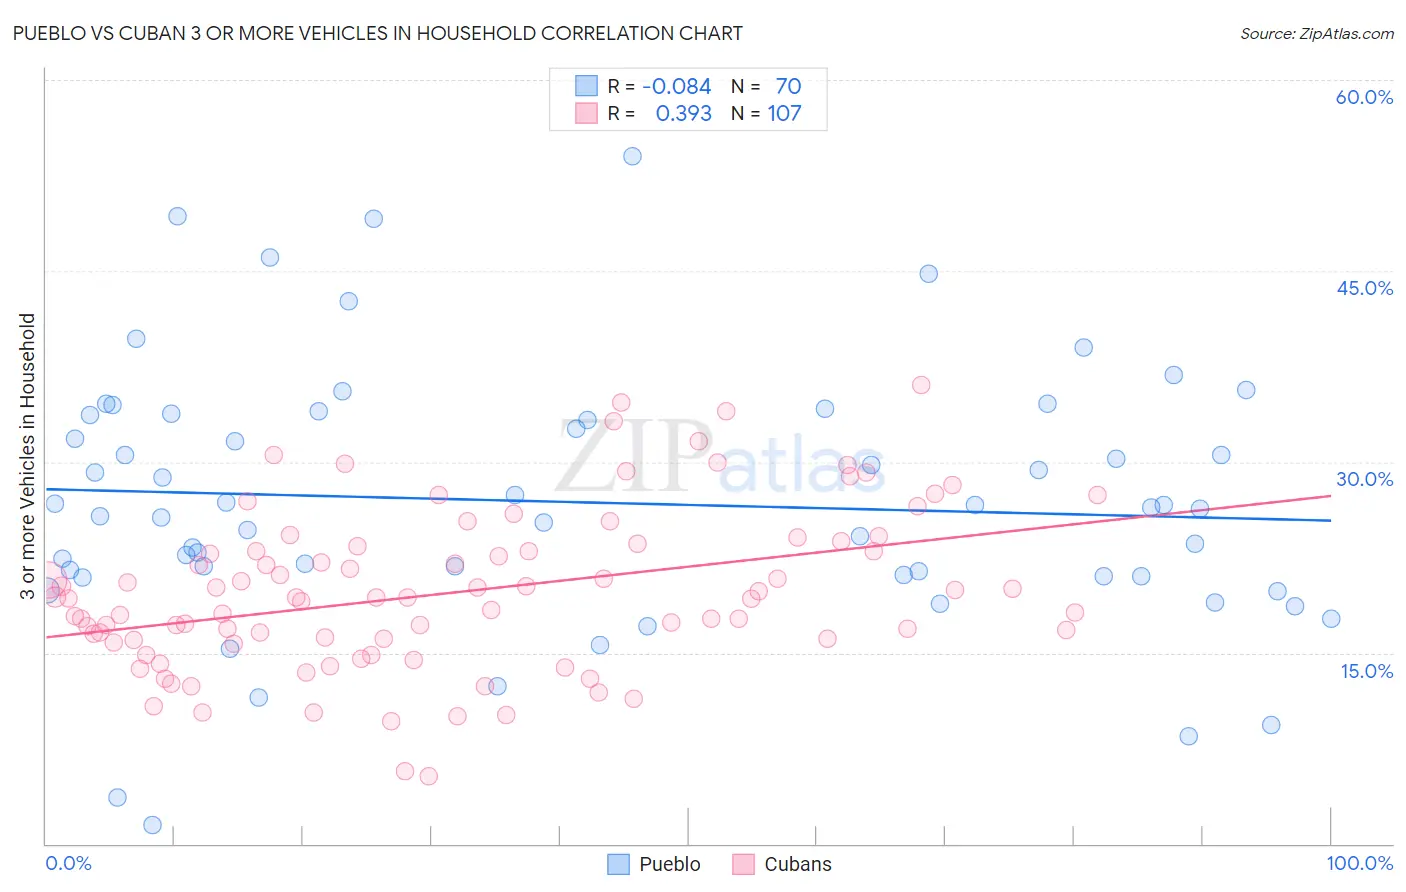
Pueblo vs Cuban 3 or more Vehicles in Household Correlation Chart
The statistical analysis conducted on geographies consisting of 120,063,355 people shows a slight negative correlation between the proportion of Pueblo and percentage of households with 3 or more vehicles available in the United States with a correlation coefficient (R) of -0.084 and weighted average of 23.0%. Similarly, the statistical analysis conducted on geographies consisting of 448,802,841 people shows a mild positive correlation between the proportion of Cubans and percentage of households with 3 or more vehicles available in the United States with a correlation coefficient (R) of 0.393 and weighted average of 19.3%, a difference of 19.3%.
3 or more Vehicles in Household Correlation Summary
| Measurement | Pueblo | Cuban |
| Minimum | 1.4% | 5.3% |
| Maximum | 54.0% | 36.0% |
| Range | 52.6% | 30.7% |
| Mean | 26.8% | 19.8% |
| Median | 26.3% | 19.3% |
| Interquartile 25% (IQ1) | 21.0% | 16.0% |
| Interquartile 75% (IQ3) | 33.7% | 23.3% |
| Interquartile Range (IQR) | 12.7% | 7.3% |
| Standard Deviation (Sample) | 10.2% | 6.3% |
| Standard Deviation (Population) | 10.1% | 6.2% |
Similar Demographics by 3 or more Vehicles in Household
Demographics Similar to Pueblo by 3 or more Vehicles in Household
In terms of 3 or more vehicles in household, the demographic groups most similar to Pueblo are Spanish American (23.0%, a difference of 0.060%), English (23.1%, a difference of 0.090%), Swiss (23.0%, a difference of 0.11%), Choctaw (23.0%, a difference of 0.13%), and Cherokee (23.0%, a difference of 0.17%).
| Demographics | Rating | Rank | 3 or more Vehicles in Household |
| Immigrants | Central America | 100.0 /100 | #25 | Exceptional 23.4% |
| Mexican American Indians | 100.0 /100 | #26 | Exceptional 23.3% |
| Guamanians/Chamorros | 100.0 /100 | #27 | Exceptional 23.2% |
| Lumbee | 100.0 /100 | #28 | Exceptional 23.1% |
| Spanish | 100.0 /100 | #29 | Exceptional 23.1% |
| Immigrants | South Eastern Asia | 100.0 /100 | #30 | Exceptional 23.1% |
| English | 100.0 /100 | #31 | Exceptional 23.1% |
| Pueblo | 100.0 /100 | #32 | Exceptional 23.0% |
| Spanish Americans | 100.0 /100 | #33 | Exceptional 23.0% |
| Swiss | 100.0 /100 | #34 | Exceptional 23.0% |
| Choctaw | 100.0 /100 | #35 | Exceptional 23.0% |
| Cherokee | 100.0 /100 | #36 | Exceptional 23.0% |
| Swedes | 100.0 /100 | #37 | Exceptional 23.0% |
| Dutch | 100.0 /100 | #38 | Exceptional 22.9% |
| Yaqui | 100.0 /100 | #39 | Exceptional 22.9% |
Demographics Similar to Cubans by 3 or more Vehicles in Household
In terms of 3 or more vehicles in household, the demographic groups most similar to Cubans are Romanian (19.3%, a difference of 0.040%), Cajun (19.3%, a difference of 0.050%), South African (19.3%, a difference of 0.070%), Latvian (19.3%, a difference of 0.070%), and Immigrants from South Central Asia (19.3%, a difference of 0.19%).
| Demographics | Rating | Rank | 3 or more Vehicles in Household |
| Syrians | 47.0 /100 | #175 | Average 19.5% |
| Iroquois | 46.0 /100 | #176 | Average 19.4% |
| Immigrants | Peru | 41.1 /100 | #177 | Average 19.4% |
| Immigrants | Syria | 40.3 /100 | #178 | Average 19.4% |
| Immigrants | South Central Asia | 38.9 /100 | #179 | Fair 19.3% |
| South Africans | 37.5 /100 | #180 | Fair 19.3% |
| Romanians | 37.1 /100 | #181 | Fair 19.3% |
| Cubans | 36.6 /100 | #182 | Fair 19.3% |
| Cajuns | 36.0 /100 | #183 | Fair 19.3% |
| Latvians | 35.7 /100 | #184 | Fair 19.3% |
| Immigrants | Sri Lanka | 30.7 /100 | #185 | Fair 19.2% |
| Immigrants | Sweden | 29.0 /100 | #186 | Fair 19.2% |
| Immigrants | Hong Kong | 28.3 /100 | #187 | Fair 19.2% |
| Immigrants | Kuwait | 26.1 /100 | #188 | Fair 19.1% |
| Indians (Asian) | 26.0 /100 | #189 | Fair 19.1% |