Pueblo vs Fijian 3 or more Vehicles in Household
COMPARE
Pueblo
Fijian
3 or more Vehicles in Household
3 or more Vehicles in Household Comparison
Pueblo
Fijians
23.0%
3 OR MORE VEHICLES IN HOUSEHOLD
100.0/ 100
METRIC RATING
32nd/ 347
METRIC RANK
22.2%
3 OR MORE VEHICLES IN HOUSEHOLD
99.9/ 100
METRIC RATING
62nd/ 347
METRIC RANK
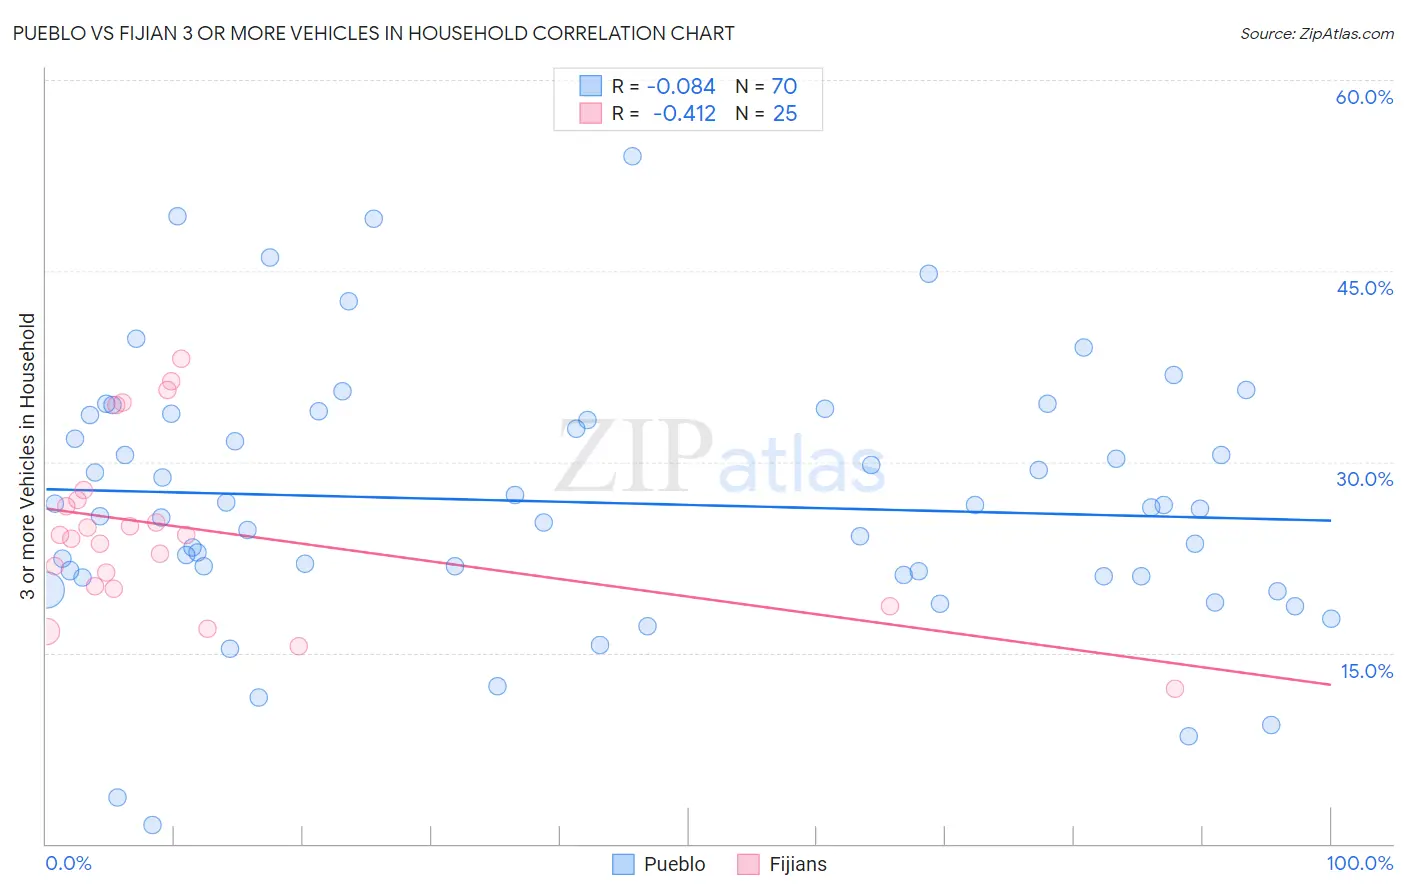
Pueblo vs Fijian 3 or more Vehicles in Household Correlation Chart
The statistical analysis conducted on geographies consisting of 120,063,355 people shows a slight negative correlation between the proportion of Pueblo and percentage of households with 3 or more vehicles available in the United States with a correlation coefficient (R) of -0.084 and weighted average of 23.0%. Similarly, the statistical analysis conducted on geographies consisting of 55,946,272 people shows a moderate negative correlation between the proportion of Fijians and percentage of households with 3 or more vehicles available in the United States with a correlation coefficient (R) of -0.412 and weighted average of 22.2%, a difference of 3.6%.
3 or more Vehicles in Household Correlation Summary
| Measurement | Pueblo | Fijian |
| Minimum | 1.4% | 12.2% |
| Maximum | 54.0% | 38.1% |
| Range | 52.6% | 26.0% |
| Mean | 26.8% | 24.7% |
| Median | 26.3% | 24.3% |
| Interquartile 25% (IQ1) | 21.0% | 20.1% |
| Interquartile 75% (IQ3) | 33.7% | 27.4% |
| Interquartile Range (IQR) | 12.7% | 7.3% |
| Standard Deviation (Sample) | 10.2% | 6.8% |
| Standard Deviation (Population) | 10.1% | 6.7% |
Similar Demographics by 3 or more Vehicles in Household
Demographics Similar to Pueblo by 3 or more Vehicles in Household
In terms of 3 or more vehicles in household, the demographic groups most similar to Pueblo are Spanish American (23.0%, a difference of 0.060%), English (23.1%, a difference of 0.090%), Swiss (23.0%, a difference of 0.11%), Choctaw (23.0%, a difference of 0.13%), and Cherokee (23.0%, a difference of 0.17%).
| Demographics | Rating | Rank | 3 or more Vehicles in Household |
| Immigrants | Central America | 100.0 /100 | #25 | Exceptional 23.4% |
| Mexican American Indians | 100.0 /100 | #26 | Exceptional 23.3% |
| Guamanians/Chamorros | 100.0 /100 | #27 | Exceptional 23.2% |
| Lumbee | 100.0 /100 | #28 | Exceptional 23.1% |
| Spanish | 100.0 /100 | #29 | Exceptional 23.1% |
| Immigrants | South Eastern Asia | 100.0 /100 | #30 | Exceptional 23.1% |
| English | 100.0 /100 | #31 | Exceptional 23.1% |
| Pueblo | 100.0 /100 | #32 | Exceptional 23.0% |
| Spanish Americans | 100.0 /100 | #33 | Exceptional 23.0% |
| Swiss | 100.0 /100 | #34 | Exceptional 23.0% |
| Choctaw | 100.0 /100 | #35 | Exceptional 23.0% |
| Cherokee | 100.0 /100 | #36 | Exceptional 23.0% |
| Swedes | 100.0 /100 | #37 | Exceptional 23.0% |
| Dutch | 100.0 /100 | #38 | Exceptional 22.9% |
| Yaqui | 100.0 /100 | #39 | Exceptional 22.9% |
Demographics Similar to Fijians by 3 or more Vehicles in Household
In terms of 3 or more vehicles in household, the demographic groups most similar to Fijians are Bhutanese (22.2%, a difference of 0.040%), Chickasaw (22.2%, a difference of 0.16%), Finnish (22.3%, a difference of 0.20%), Navajo (22.3%, a difference of 0.28%), and Spaniard (22.3%, a difference of 0.35%).
| Demographics | Rating | Rank | 3 or more Vehicles in Household |
| Immigrants | Laos | 100.0 /100 | #55 | Exceptional 22.4% |
| Hispanics or Latinos | 100.0 /100 | #56 | Exceptional 22.4% |
| Pennsylvania Germans | 100.0 /100 | #57 | Exceptional 22.3% |
| Spaniards | 100.0 /100 | #58 | Exceptional 22.3% |
| Navajo | 100.0 /100 | #59 | Exceptional 22.3% |
| Finns | 99.9 /100 | #60 | Exceptional 22.3% |
| Bhutanese | 99.9 /100 | #61 | Exceptional 22.2% |
| Fijians | 99.9 /100 | #62 | Exceptional 22.2% |
| Chickasaw | 99.9 /100 | #63 | Exceptional 22.2% |
| Immigrants | Taiwan | 99.9 /100 | #64 | Exceptional 22.1% |
| Pima | 99.9 /100 | #65 | Exceptional 22.0% |
| Northern Europeans | 99.9 /100 | #66 | Exceptional 22.0% |
| Alaskan Athabascans | 99.9 /100 | #67 | Exceptional 21.9% |
| British | 99.9 /100 | #68 | Exceptional 21.9% |
| Creek | 99.9 /100 | #69 | Exceptional 21.9% |