Immigrants from Afghanistan vs Cuban 3 or more Vehicles in Household
COMPARE
Immigrants from Afghanistan
Cuban
3 or more Vehicles in Household
3 or more Vehicles in Household Comparison
Immigrants from Afghanistan
Cubans
21.2%
3 OR MORE VEHICLES IN HOUSEHOLD
99.1/ 100
METRIC RATING
90th/ 347
METRIC RANK
19.3%
3 OR MORE VEHICLES IN HOUSEHOLD
36.6/ 100
METRIC RATING
182nd/ 347
METRIC RANK
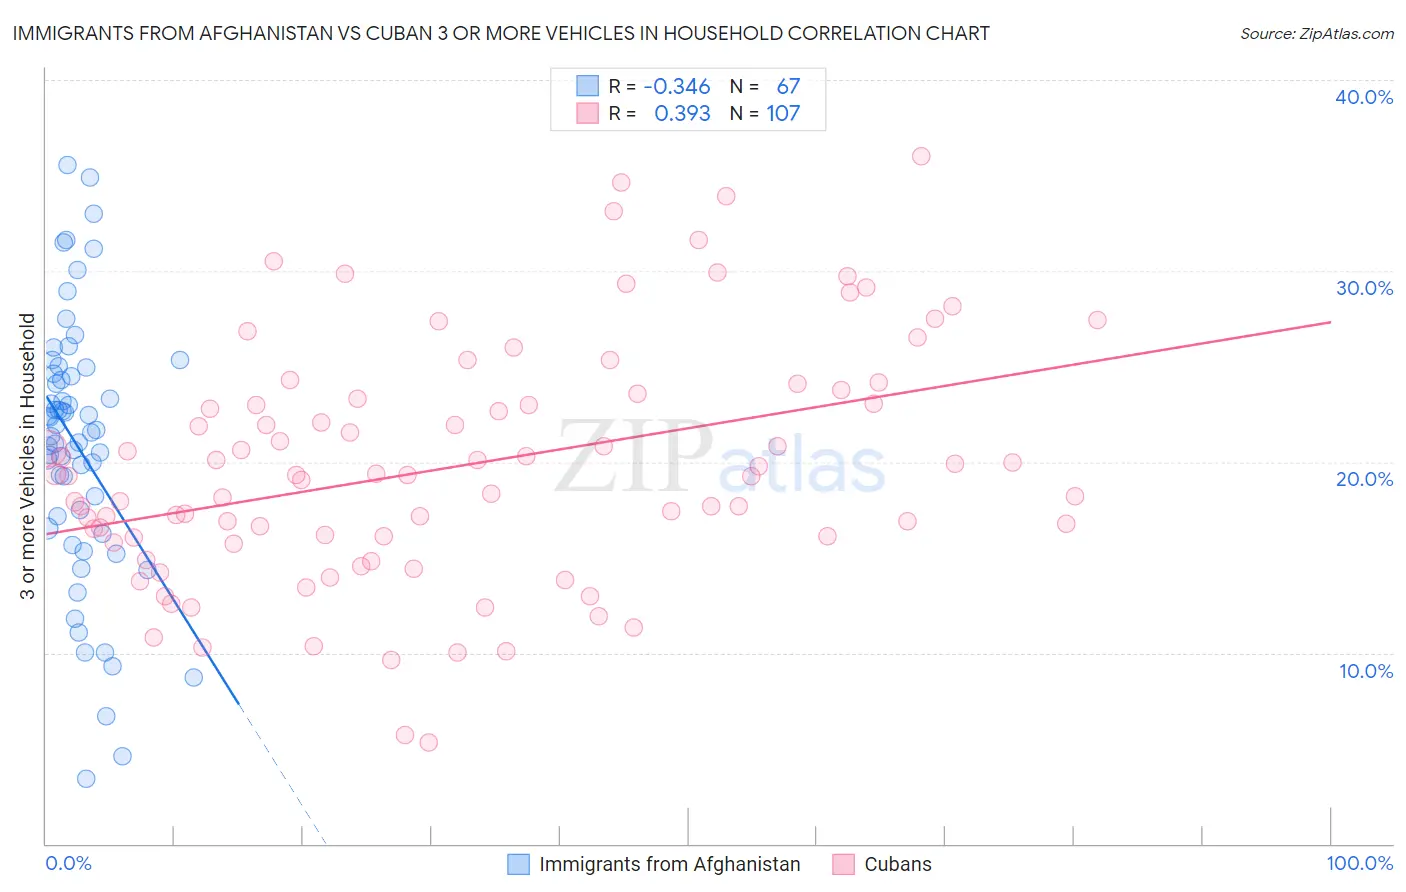
Immigrants from Afghanistan vs Cuban 3 or more Vehicles in Household Correlation Chart
The statistical analysis conducted on geographies consisting of 147,579,076 people shows a mild negative correlation between the proportion of Immigrants from Afghanistan and percentage of households with 3 or more vehicles available in the United States with a correlation coefficient (R) of -0.346 and weighted average of 21.2%. Similarly, the statistical analysis conducted on geographies consisting of 448,802,841 people shows a mild positive correlation between the proportion of Cubans and percentage of households with 3 or more vehicles available in the United States with a correlation coefficient (R) of 0.393 and weighted average of 19.3%, a difference of 10.1%.
3 or more Vehicles in Household Correlation Summary
| Measurement | Immigrants from Afghanistan | Cuban |
| Minimum | 3.4% | 5.3% |
| Maximum | 35.6% | 36.0% |
| Range | 32.2% | 30.7% |
| Mean | 20.7% | 19.8% |
| Median | 21.5% | 19.3% |
| Interquartile 25% (IQ1) | 16.5% | 16.0% |
| Interquartile 75% (IQ3) | 24.6% | 23.3% |
| Interquartile Range (IQR) | 8.1% | 7.3% |
| Standard Deviation (Sample) | 6.9% | 6.3% |
| Standard Deviation (Population) | 6.8% | 6.2% |
Similar Demographics by 3 or more Vehicles in Household
Demographics Similar to Immigrants from Afghanistan by 3 or more Vehicles in Household
In terms of 3 or more vehicles in household, the demographic groups most similar to Immigrants from Afghanistan are Marshallese (21.3%, a difference of 0.22%), Belgian (21.2%, a difference of 0.33%), Apache (21.2%, a difference of 0.41%), Immigrants from Indonesia (21.1%, a difference of 0.61%), and French (21.4%, a difference of 0.78%).
| Demographics | Rating | Rank | 3 or more Vehicles in Household |
| Chippewa | 99.6 /100 | #83 | Exceptional 21.5% |
| Icelanders | 99.6 /100 | #84 | Exceptional 21.5% |
| Laotians | 99.6 /100 | #85 | Exceptional 21.5% |
| Delaware | 99.6 /100 | #86 | Exceptional 21.5% |
| Immigrants | Azores | 99.5 /100 | #87 | Exceptional 21.5% |
| French | 99.4 /100 | #88 | Exceptional 21.4% |
| Marshallese | 99.2 /100 | #89 | Exceptional 21.3% |
| Immigrants | Afghanistan | 99.1 /100 | #90 | Exceptional 21.2% |
| Belgians | 98.9 /100 | #91 | Exceptional 21.2% |
| Apache | 98.9 /100 | #92 | Exceptional 21.2% |
| Immigrants | Indonesia | 98.8 /100 | #93 | Exceptional 21.1% |
| Immigrants | Cambodia | 98.6 /100 | #94 | Exceptional 21.1% |
| Pakistanis | 98.5 /100 | #95 | Exceptional 21.0% |
| Cree | 98.4 /100 | #96 | Exceptional 21.0% |
| Canadians | 98.3 /100 | #97 | Exceptional 21.0% |
Demographics Similar to Cubans by 3 or more Vehicles in Household
In terms of 3 or more vehicles in household, the demographic groups most similar to Cubans are Romanian (19.3%, a difference of 0.040%), Cajun (19.3%, a difference of 0.050%), South African (19.3%, a difference of 0.070%), Latvian (19.3%, a difference of 0.070%), and Immigrants from South Central Asia (19.3%, a difference of 0.19%).
| Demographics | Rating | Rank | 3 or more Vehicles in Household |
| Syrians | 47.0 /100 | #175 | Average 19.5% |
| Iroquois | 46.0 /100 | #176 | Average 19.4% |
| Immigrants | Peru | 41.1 /100 | #177 | Average 19.4% |
| Immigrants | Syria | 40.3 /100 | #178 | Average 19.4% |
| Immigrants | South Central Asia | 38.9 /100 | #179 | Fair 19.3% |
| South Africans | 37.5 /100 | #180 | Fair 19.3% |
| Romanians | 37.1 /100 | #181 | Fair 19.3% |
| Cubans | 36.6 /100 | #182 | Fair 19.3% |
| Cajuns | 36.0 /100 | #183 | Fair 19.3% |
| Latvians | 35.7 /100 | #184 | Fair 19.3% |
| Immigrants | Sri Lanka | 30.7 /100 | #185 | Fair 19.2% |
| Immigrants | Sweden | 29.0 /100 | #186 | Fair 19.2% |
| Immigrants | Hong Kong | 28.3 /100 | #187 | Fair 19.2% |
| Immigrants | Kuwait | 26.1 /100 | #188 | Fair 19.1% |
| Indians (Asian) | 26.0 /100 | #189 | Fair 19.1% |