Paraguayan vs Belizean 1 or more Vehicles in Household
COMPARE
Paraguayan
Belizean
1 or more Vehicles in Household
1 or more Vehicles in Household Comparison
Paraguayans
Belizeans
85.7%
1 OR MORE VEHICLES IN HOUSEHOLD
0.0/ 100
METRIC RATING
297th/ 347
METRIC RANK
85.7%
1 OR MORE VEHICLES IN HOUSEHOLD
0.0/ 100
METRIC RATING
298th/ 347
METRIC RANK
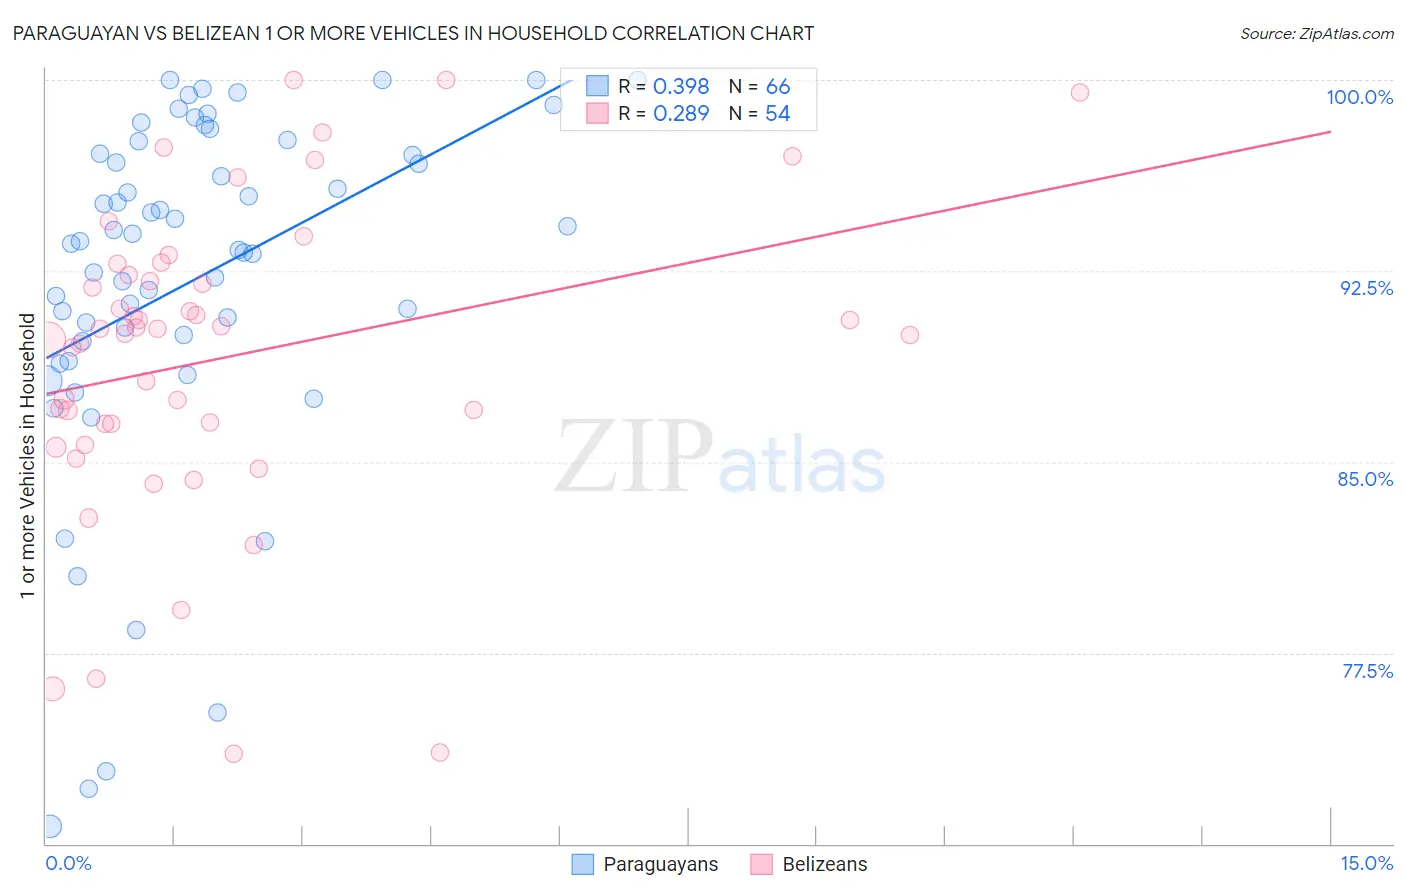
Paraguayan vs Belizean 1 or more Vehicles in Household Correlation Chart
The statistical analysis conducted on geographies consisting of 94,974,257 people shows a mild positive correlation between the proportion of Paraguayans and percentage of households with 1 or more vehicles available in the United States with a correlation coefficient (R) of 0.398 and weighted average of 85.7%. Similarly, the statistical analysis conducted on geographies consisting of 144,165,172 people shows a weak positive correlation between the proportion of Belizeans and percentage of households with 1 or more vehicles available in the United States with a correlation coefficient (R) of 0.289 and weighted average of 85.7%, a difference of 0.080%.
1 or more Vehicles in Household Correlation Summary
| Measurement | Paraguayan | Belizean |
| Minimum | 70.7% | 73.5% |
| Maximum | 100.0% | 100.0% |
| Range | 29.3% | 26.5% |
| Mean | 92.1% | 89.1% |
| Median | 93.6% | 90.1% |
| Interquartile 25% (IQ1) | 89.7% | 86.5% |
| Interquartile 75% (IQ3) | 97.1% | 92.4% |
| Interquartile Range (IQR) | 7.4% | 5.9% |
| Standard Deviation (Sample) | 7.0% | 6.1% |
| Standard Deviation (Population) | 6.9% | 6.0% |
Demographics Similar to Paraguayans and Belizeans by 1 or more Vehicles in Household
In terms of 1 or more vehicles in household, the demographic groups most similar to Paraguayans are Immigrants from Spain (85.8%, a difference of 0.090%), Immigrants from Jamaica (85.8%, a difference of 0.12%), Alaskan Athabascan (86.0%, a difference of 0.29%), Yuman (85.5%, a difference of 0.33%), and Immigrants from Russia (85.4%, a difference of 0.33%). Similarly, the demographic groups most similar to Belizeans are Immigrants from Spain (85.8%, a difference of 0.17%), Immigrants from Jamaica (85.8%, a difference of 0.20%), Yuman (85.5%, a difference of 0.24%), Immigrants from Russia (85.4%, a difference of 0.25%), and Immigrants from Panama (85.4%, a difference of 0.29%).
| Demographics | Rating | Rank | 1 or more Vehicles in Household |
| Immigrants | Malaysia | 0.0 /100 | #287 | Tragic 86.5% |
| Hopi | 0.0 /100 | #288 | Tragic 86.4% |
| Immigrants | Ireland | 0.0 /100 | #289 | Tragic 86.4% |
| Immigrants | Australia | 0.0 /100 | #290 | Tragic 86.4% |
| Pima | 0.0 /100 | #291 | Tragic 86.3% |
| Okinawans | 0.0 /100 | #292 | Tragic 86.1% |
| Indians (Asian) | 0.0 /100 | #293 | Tragic 86.0% |
| Alaskan Athabascans | 0.0 /100 | #294 | Tragic 86.0% |
| Immigrants | Jamaica | 0.0 /100 | #295 | Tragic 85.8% |
| Immigrants | Spain | 0.0 /100 | #296 | Tragic 85.8% |
| Paraguayans | 0.0 /100 | #297 | Tragic 85.7% |
| Belizeans | 0.0 /100 | #298 | Tragic 85.7% |
| Yuman | 0.0 /100 | #299 | Tragic 85.5% |
| Immigrants | Russia | 0.0 /100 | #300 | Tragic 85.4% |
| Immigrants | Panama | 0.0 /100 | #301 | Tragic 85.4% |
| Moroccans | 0.0 /100 | #302 | Tragic 85.4% |
| Immigrants | Greece | 0.0 /100 | #303 | Tragic 85.4% |
| Immigrants | Ukraine | 0.0 /100 | #304 | Tragic 85.2% |
| Immigrants | China | 0.0 /100 | #305 | Tragic 84.9% |
| Immigrants | Western Africa | 0.0 /100 | #306 | Tragic 84.9% |
| Tohono O'odham | 0.0 /100 | #307 | Tragic 84.7% |