Immigrants from Nigeria vs Belizean 1 or more Vehicles in Household
COMPARE
Immigrants from Nigeria
Belizean
1 or more Vehicles in Household
1 or more Vehicles in Household Comparison
Immigrants from Nigeria
Belizeans
88.2%
1 OR MORE VEHICLES IN HOUSEHOLD
1.5/ 100
METRIC RATING
248th/ 347
METRIC RANK
85.7%
1 OR MORE VEHICLES IN HOUSEHOLD
0.0/ 100
METRIC RATING
298th/ 347
METRIC RANK
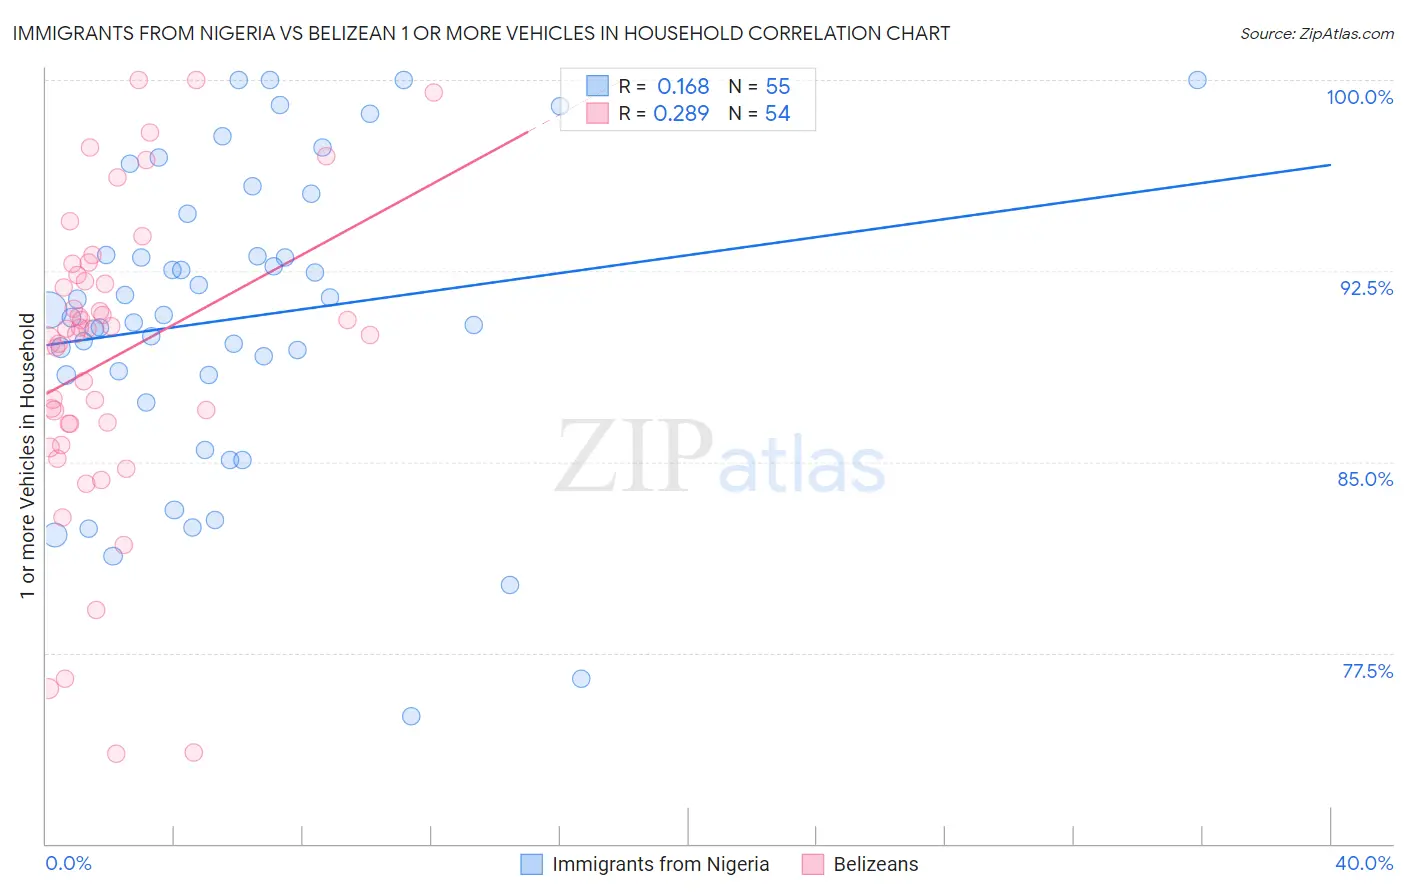
Immigrants from Nigeria vs Belizean 1 or more Vehicles in Household Correlation Chart
The statistical analysis conducted on geographies consisting of 283,317,819 people shows a poor positive correlation between the proportion of Immigrants from Nigeria and percentage of households with 1 or more vehicles available in the United States with a correlation coefficient (R) of 0.168 and weighted average of 88.2%. Similarly, the statistical analysis conducted on geographies consisting of 144,165,172 people shows a weak positive correlation between the proportion of Belizeans and percentage of households with 1 or more vehicles available in the United States with a correlation coefficient (R) of 0.289 and weighted average of 85.7%, a difference of 3.0%.
1 or more Vehicles in Household Correlation Summary
| Measurement | Immigrants from Nigeria | Belizean |
| Minimum | 75.0% | 73.5% |
| Maximum | 100.0% | 100.0% |
| Range | 25.0% | 26.5% |
| Mean | 90.6% | 89.1% |
| Median | 90.8% | 90.1% |
| Interquartile 25% (IQ1) | 88.4% | 86.5% |
| Interquartile 75% (IQ3) | 94.7% | 92.4% |
| Interquartile Range (IQR) | 6.3% | 5.9% |
| Standard Deviation (Sample) | 6.0% | 6.1% |
| Standard Deviation (Population) | 5.9% | 6.0% |
Similar Demographics by 1 or more Vehicles in Household
Demographics Similar to Immigrants from Nigeria by 1 or more Vehicles in Household
In terms of 1 or more vehicles in household, the demographic groups most similar to Immigrants from Nigeria are Immigrants from Honduras (88.3%, a difference of 0.050%), Black/African American (88.2%, a difference of 0.050%), Menominee (88.3%, a difference of 0.080%), Immigrants from Czechoslovakia (88.3%, a difference of 0.090%), and Egyptian (88.2%, a difference of 0.090%).
| Demographics | Rating | Rank | 1 or more Vehicles in Household |
| Taiwanese | 2.6 /100 | #241 | Tragic 88.4% |
| Turks | 2.5 /100 | #242 | Tragic 88.4% |
| Immigrants | Belgium | 2.1 /100 | #243 | Tragic 88.4% |
| Immigrants | Portugal | 2.0 /100 | #244 | Tragic 88.3% |
| Immigrants | Czechoslovakia | 1.9 /100 | #245 | Tragic 88.3% |
| Menominee | 1.9 /100 | #246 | Tragic 88.3% |
| Immigrants | Honduras | 1.7 /100 | #247 | Tragic 88.3% |
| Immigrants | Nigeria | 1.5 /100 | #248 | Tragic 88.2% |
| Blacks/African Americans | 1.4 /100 | #249 | Tragic 88.2% |
| Egyptians | 1.2 /100 | #250 | Tragic 88.2% |
| Immigrants | Serbia | 1.2 /100 | #251 | Tragic 88.2% |
| Immigrants | Uruguay | 1.1 /100 | #252 | Tragic 88.1% |
| Hondurans | 1.0 /100 | #253 | Tragic 88.1% |
| Haitians | 0.9 /100 | #254 | Tragic 88.1% |
| Immigrants | Latvia | 0.9 /100 | #255 | Tragic 88.1% |
Demographics Similar to Belizeans by 1 or more Vehicles in Household
In terms of 1 or more vehicles in household, the demographic groups most similar to Belizeans are Paraguayan (85.7%, a difference of 0.080%), Immigrants from Spain (85.8%, a difference of 0.17%), Immigrants from Jamaica (85.8%, a difference of 0.20%), Yuman (85.5%, a difference of 0.24%), and Immigrants from Russia (85.4%, a difference of 0.25%).
| Demographics | Rating | Rank | 1 or more Vehicles in Household |
| Pima | 0.0 /100 | #291 | Tragic 86.3% |
| Okinawans | 0.0 /100 | #292 | Tragic 86.1% |
| Indians (Asian) | 0.0 /100 | #293 | Tragic 86.0% |
| Alaskan Athabascans | 0.0 /100 | #294 | Tragic 86.0% |
| Immigrants | Jamaica | 0.0 /100 | #295 | Tragic 85.8% |
| Immigrants | Spain | 0.0 /100 | #296 | Tragic 85.8% |
| Paraguayans | 0.0 /100 | #297 | Tragic 85.7% |
| Belizeans | 0.0 /100 | #298 | Tragic 85.7% |
| Yuman | 0.0 /100 | #299 | Tragic 85.5% |
| Immigrants | Russia | 0.0 /100 | #300 | Tragic 85.4% |
| Immigrants | Panama | 0.0 /100 | #301 | Tragic 85.4% |
| Moroccans | 0.0 /100 | #302 | Tragic 85.4% |
| Immigrants | Greece | 0.0 /100 | #303 | Tragic 85.4% |
| Immigrants | Ukraine | 0.0 /100 | #304 | Tragic 85.2% |
| Immigrants | China | 0.0 /100 | #305 | Tragic 84.9% |